27 April 2022: Clinical Research
Differences Between Sorafenib and Lenvatinib Treatment from Genetic and Clinical Perspectives for Patients with Hepatocellular Carcinoma
Lei Wang 1CD* , Lei Wang 23DEF* , Bo Xiao 4BC , Mingxuan Cui 4CDE , Bo Zhang 4A*DOI: 10.12659/MSM.934936
Med Sci Monit 2022; 28:e934936
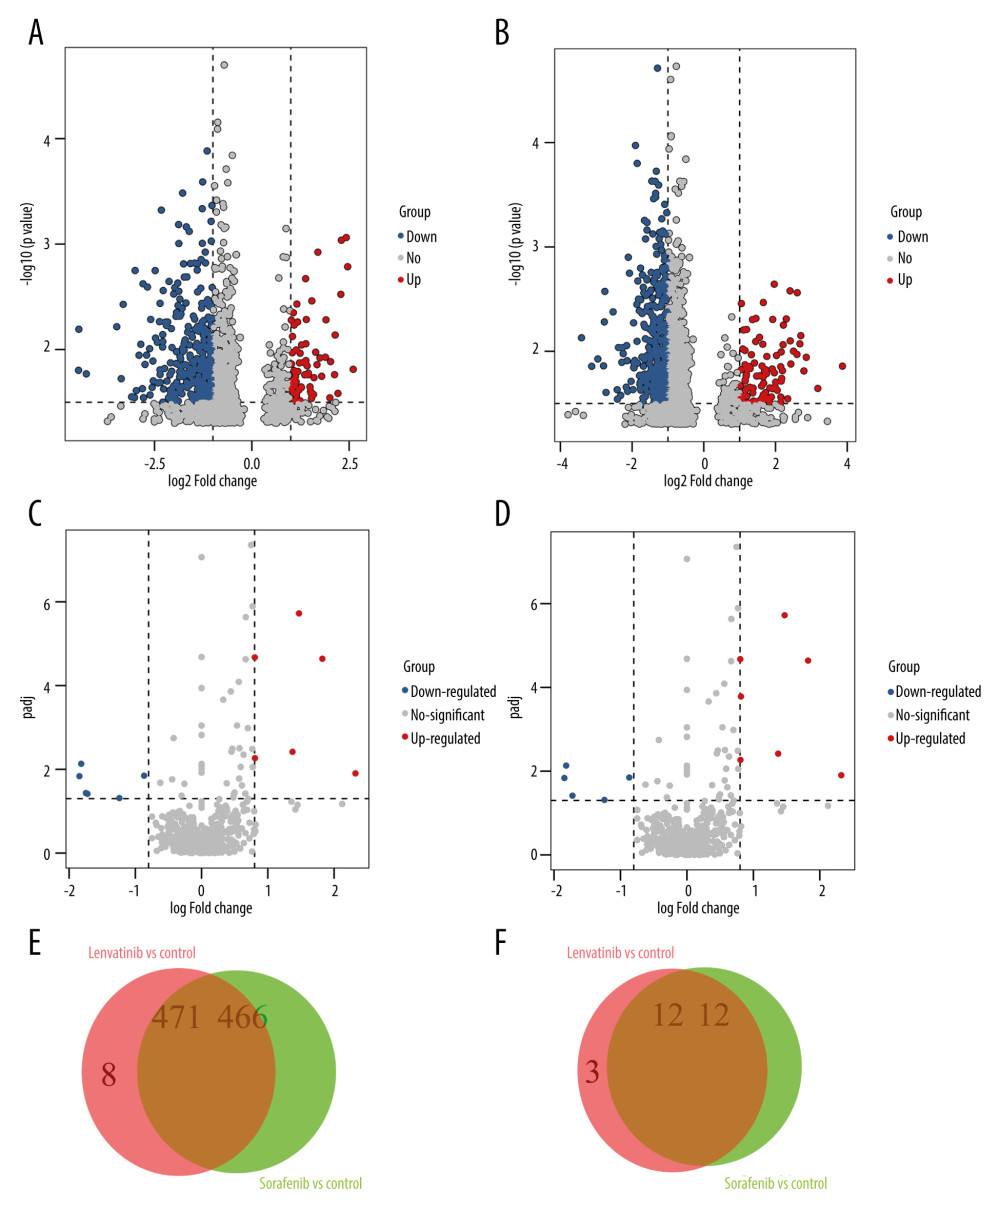
Figure 1 The differential analysis of mRNA and miRNA. (A, B) Volcano diagram of differentially expressed genes (DEGs) for Sorafenib treatment and Lenvatinib treatment, respectively. The horizontal axis is the log2FC value, while the vertical axis is −log10 (P value). Red color represents upregulation, green represents downregulation, and black represents no significant difference respectively. (C, D) The volcano diagram of differentially expressed miRNAs (DEMs). (E, F) The Venn diagrams of DEGs and DEMs for Sorafenib treatment and Lenvatinib treatment, respectively.