28 May 2023: Database Analysis
Global Research Trends and Hotspots in Lateral Epicondylitis During the Past 30 Years: A Bibliometric and Visualization Study
Jie Xu 1ADE , Meng Chen 2B , Xiali Xue 3C , Wenqi Zhou 1DF , Xiaobing Luo 1DG*DOI: 10.12659/MSM.939309
Med Sci Monit 2023; 29:e939309
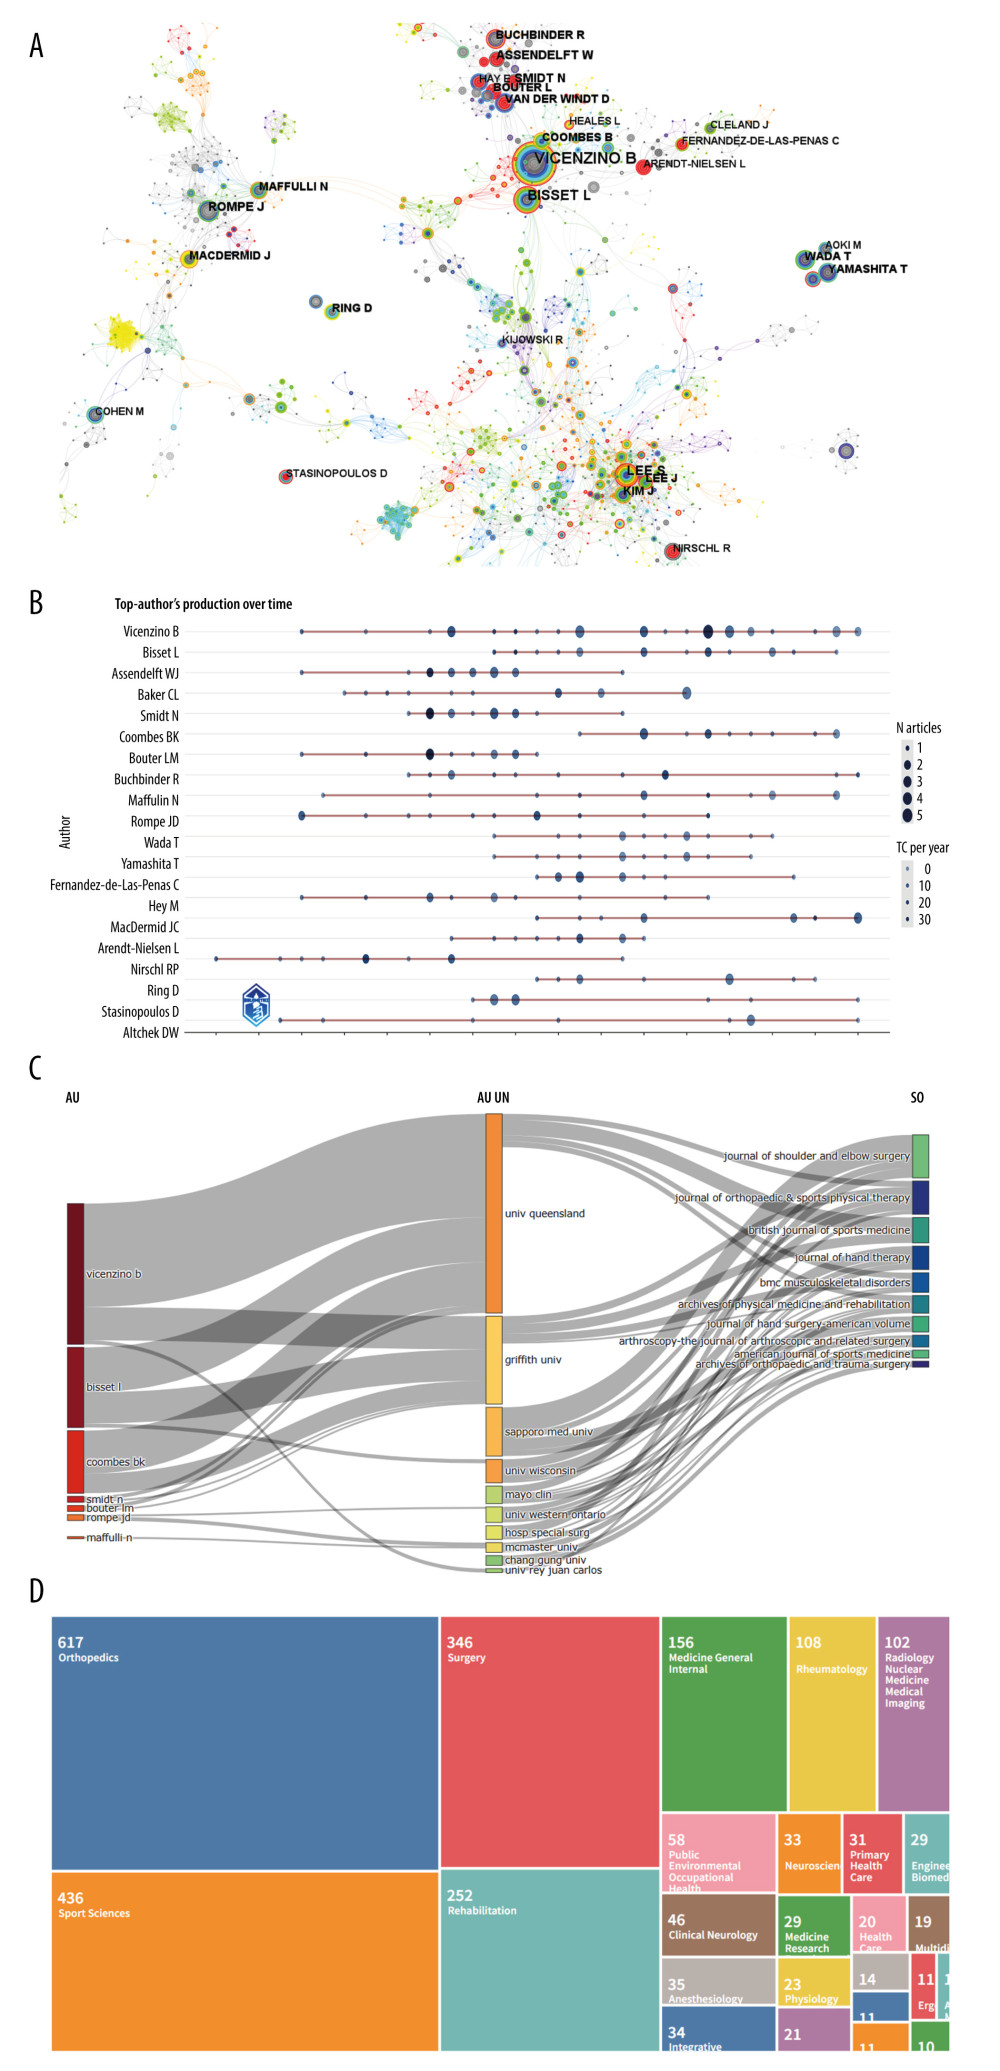
Figure 3 (A) Author co-occurrence network diagram for lateral epicondylitis. The circles in the chart indicate the volume of posts, with larger circles indicating more posts by the author, the thickness of the outer purple circle indicating author centrality, and the connecting lines indicating the existence of a collaborative or co-occurring relationship. (B) Plot of high-yielding authors of lateral epicondylitis over time. The top 20 most prolific researchers in the field and their publications. The larger the node, the more literature published. The darker the color, the more citations. Dark blue represents the number of publications and light blue represents the number of citations per year. (C) The three-field plot showing the knowledge flow of lateral epicondylitis. (D) Distribution of hotspots of research in the literature on lateral epicondylitis by discipline.