27 October 2022: Clinical Research
Retrospective Study from a Single Center in Poland of Postoperative Outcomes of Muscle Strength in Patients After Surgical Suturing of the Achilles Tendon Using a Kessler’s Suture and 28 Weeks of Supervised Postoperative Physiotherapy
Łukasz Sikorski1BCDEF*, Andrzej Czamara12ABDEGDOI: 10.12659/MSM.938267
Med Sci Monit 2022; 28:e938267


Abstract
BACKGROUND: A retrospective study from a single center in Poland was aimed to evaluate the effect of 47 supervised physiotherapy (SVPh) visits on relative peak torque (RPT) and relative isometric torque (RIT) of foot plantar flexion muscles (FPFM) and foot dorsiflexion muscles (FDFM) with a frequency of 1.7 visits per week conducted for 28 weeks after surgical suturing of the Achilles tendon using a Kessler’s suture (ATSSKS). We hypothesized a higher number, frequency, and intensity of supervised physiotherapy visits (HNFISVPhVs) would correlate with and significantly improve RIT and RPT for FPFM.
MATERIAL AND METHODS: Group A included 20 patients (x=47 visits) after ATSSKS with one SVPh protocol who were divided into subgroups: with HNFISVPhVs (x=72) and with a lower number, frequency, and intensity of SVPh visits (LNFISVPhVs, x=33). Twenty participants without Achilles tendon rupture were included in group B (control). Both groups (≥7 Tegner activity scale) underwent RIT, RPT, and Limb Symmetry Index (LSI) measurements using Biodex Medical System 3.
RESULTS: FPFM RIT were significantly lower in operated limbs in group A than for non-operated limbs in group B (P≤0.001). HNFISVPhVs correlated with higher FPFM RIT and LSI in operated limbs (from r=0.444, P=0.05 to r=0.585, P=0.007). HNFISVPhVs obtained higher LSI of FPFM RPT of 180°/s (P=0.022) and 30°/s (P=0.049) than LNFISVPhVs.
CONCLUSIONS: SVPh with 47 visits after ATSSKS for 28 weeks was insufficient to obtain equal values of RIT for FPFM and FDFM, but HNFISVPhVs correlated with higher RIT values and considerably improved RIT and RPT for FPFM compared with LNFISVPhVs.
Keywords: Achilles Tendon, Muscle, Skeletal, Rehabilitation, Vocational, Humans, Rupture, Poland, muscle strength, Sutures, Physical Therapy Modalities, Treatment Outcome
Background
Surgical treatment using the open method, which uses various types of suturing techniques to restore the continuity of the torn Achilles tendon (AT), is recommended for all patients who want to return to full sports activities [1] and allows patients to return to their level of sports activity from before its damage [2]. One of the crucial criteria for the patient, or player, to return to sports activity after the surgical suturing of the AT is to restore the symmetrical values of maximal isometric torque (IT) and maximal peak torque (PT) of injured limbs to the values of the non-operated limbs [3]. The results in strength also depend on the operating method, postoperative recommendations, time to heal and start loading the operated tissue, patient age and sex, and patient’s motivation for treatment [4]. Persistently lower IT and PT for foot plantar flexor muscles (FPFM) or foot dorsal flexors muscles (FDFM) in the operated limbs can deteriorate the quality of gait and stability of the lower limbs during physical activity [5].
Supervised postoperative physiotherapy (SVPh) is conducted by a physiotherapist according to an established protocol, in coordination with the attending physician [6]. Calder et al, based on the clinical rating system for the ankle-hindfoot, midfoot, hallux, and lesser toes, claimed that the use of supervised active rehabilitation after surgical AT suturing allows patients to return to sedentary work faster (on average 3 weeks after surgery) than patients without active supervised rehabilitation (between 6 and 13 weeks after surgery); however, the authors did not present a detailed physiotherapy protocol in the literature [7]. Strom et al indicated a beneficial effect of conducted physiotherapy and SVPh but did not assess the impact of the number of these visits on the final results obtained by patients [8]. Nevertheless, there is no unequivocal answer whether the number, frequency, and intensity of postoperative physiotherapy visits have an impact on the maximal IT and PT values obtained for the FPFM of the ankle joint. We do not have comprehensive knowledge of whether the above-mentioned factors can affect the level of symmetry of the IT and PT values acting on the ankle joint in the sagittal plane between the non-operated and operated limbs after an open surgical suturing of the AT via Kessler’s method. We assessed the impact of SVPh on the values of the vertical component of ground reaction forces during both-legged and single-legged vertical hops and the quality of gait in patients after Achilles tendon surgical suturing using Kessler’s suture (ATSSKS) in 2 previously published articles [9,10]. Based on these studies, we ascertained that a greater number of visits correlated with more symmetrical results of the kinematic and spatiotemporal gait values between the lower limbs and the values of vertical components of the ground reaction forces during both-legged and single-legged hops. In the present study, we evaluated the SVPh on the relative isometric torque (RIT) and relative maximal peak torque (RPT) values of patients after ATSSKS using the Biodex Medical System 3 dynamometer station for FPFM and FDFM muscles [11], with a high level of activity estimated using the Tegner activity scale [12].
The goal of this retrospective study from a single center in Poland was to evaluate the influence of 47 visits of SVPh at a frequency of 1.7 per week conducted for 28 weeks on the relative maximal IT values and the relative maximal PT values for FPFM and FDFM of the ankle joints after ATSSKS.
We hypothesized that a higher number, frequency, and intensity of supervised physiotherapy visits after an open ATSSKS would correlate with and result in acquiring higher relative maximal IT values and relative maximal PT values obtained for FPFM.
Material and Methods
ETHICS STATEMENT:
The research was conducted at the Center of Rehabilitation and Medical Education and the College of Physiotherapy in Wroclaw (Institute of Physiotherapy) in accordance with the guidelines and principles of the Declaration of Helsinki. Written consent for the research was given by the participants, as well as by the Committee on Research Ethics of the College of Physiotherapy in Wrocław, No. 1/2019 (February 11, 2019). The study had a retrospective and observational design and was performed between 2008 and 2019
MATERIAL:
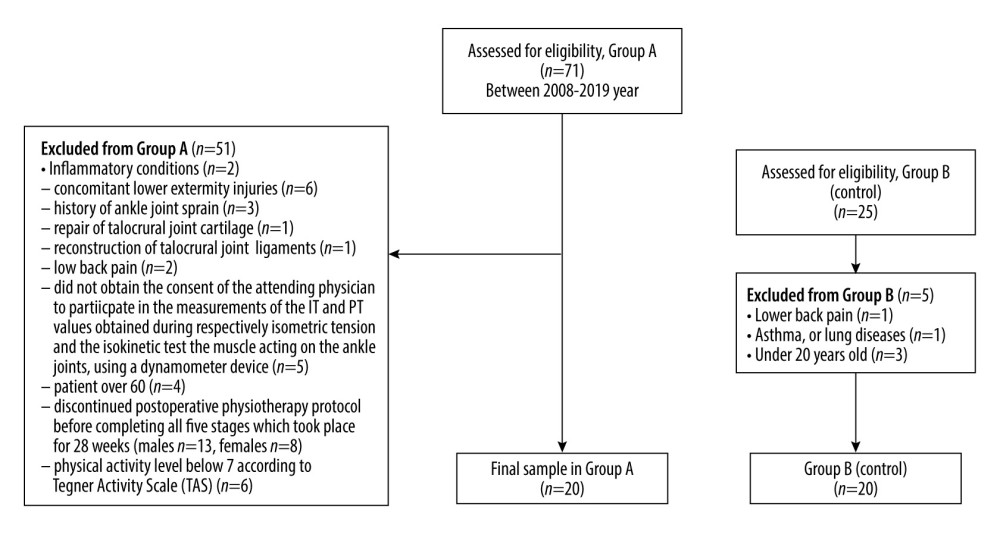
The target group A included patients who participated in postoperative physiotherapy at the Center for Rehabilitation and Medical Education, as recommended by the attending physician [6]. Initially, the study included 71 patients (63 men, 8 women) who began postoperative physiotherapy after an open suturing method of the AT. Criteria for inclusion in the study were as follows: unilateral damage to the full continuity of the AT, age between 20 and 60 years, 1-sided suturing of the AT applying an open method, lack of complications after the surgery and no prevalence of concomitant diseases, and use of only 1 protocol of SVPh with a level of physical activity above 6 on the Tegner activity scale (Table 1), which participants answered before starting the SVPh [12]. The exclusion criteria for the study were as follows: inflammation of the operated AT, coexisting injuries of the lower limbs, previous ankle sprains, ankle cartilage repair, ankle ligament reconstruction, and pain in the lumbar spine. Patients who did not obtain approval from the treating physician were excluded from participating in the maximal torque value measurements triggered during isometric tension and under the isokinetic test conditions of the ankle muscles using a dynamometric device. Patients over 60 years old and those below 20 years old were excluded. Also excluded were patients that did not finish 5 stages of SVPh conducted by 1 physiotherapist at the same rehabilitation center [6] and those who scored the level of physical activity below 7 on the Tegner activity scale.
The patients from group A underwent 28 weeks of SVPh, conducted by a single physiotherapist [6]. The duration of 1 supervised physiotherapeutic visit was 2 h. Group B consisted of volunteer participants without lower limb injuries and concomitant diseases. Details of the participants in each group of this study are presented in in Figure 1.
Considering the patients’ medical records and after interviewing the patients about their health, some patients had to be excluded from the study for injuries, such as inflammation (2 patients), lower limbs injuries (6 patients), previous ankle sprains (3 patients), ankle cartilage repair (1 patient), ankle ligament reconstruction (1 patient), and pain in the lumbar spine (2 patients). Five patients who did not obtain approval from the treating physician were excluded to participate in the maximal torque value measurements triggered during isometric tension and under the isokinetic test conditions of the ankle muscles using a dynamometric device. Four patients who were over 60 years old, 21 patients (13 men, 8 women) who did not finish 5 stages of SVPh conducted by a single physiotherapist at the same rehabilitation center, and 6 patients whose activity was below 7 on the Tegner activity scale (Table 1) were excluded from the study [12]. Originally, group B (control) included 25 men without previous AT injuries, and their physical activity was above 6 on the Tegner activity scale. Men with chronic lower lumbar pain (n=1), lung diseases or asthma (n=1),and those who were not 20 years old (n=3, Figure 1) were excluded from the study.
Finally, 20 male patients after open ATSSKS were included in group A, and 20 male participants without AT and ankle injuries were included in group B. Groups A and B were not significantly different in terms of age and height; however, they differed statistically significantly in weight (P=0.020, Table 2). For this reason, the IT and PT values were normalized per kilogram of the patient’s body weight (N*m/kg). The patients were compared in terms of the body mass index (BMI), which showed no significant differences (P=0.117) between the study groups (Table 2). Also, the scores on the Tegner activity scale showed no significant differences between group A and group B (P=0.417; Table 2). Group A completed an average of 47 visits of SVPh after the open ATSSKS (from 24 to 83 visits, Table 2). The frequency of SVPh visits each week in group A was 1.69 (from 0.9 to 3 visits, Table 2); it was assumed that patients participated in 1.7 visits per week. The average number of SVPh visits in group A in the last 2 stages, which were responsible for restoring muscle strength and power, was 13 (from 2 to 38 visits, Table 2). The average frequency of SVPh visits in the last 2 stages in each week in group A was 0.87 (from 0.13 to 2.53 visits, Table 2). Additionally, group A was divided into 2 smaller subgroups, in which the difference in visits reached 20%. In subgroup IA, patients completed at least 56 visits of SVPh. In subgroup IB, patients completed fewer than 40 visits of SVPh. The difference in the number of supervised visits carried out by the physiotherapist in the entire group A was determined by the final decision of the patients, who individually decided about the number and frequency of this therapy. The leading physiotherapist motivated the patients to attend systematic sessions of postoperative physiotherapy 3 to 4 times a week after ATSSKS. Six patients, with an average of 71.67 visits (from 56 to 83 visits, Table 2), were qualified for subgroup IA, and 9 patients, with an average of 33.22 visits (from 24 to 39 visits, Table 2), were qualified for subgroup IB. It was assumed that the patients in subgroup IA participated in an average of 72 visits, and patients in subgroup IB participated in an average of 33 visits, guided and supervised by a physiotherapist after ATSSKS. The frequency of SVPh visits each week in subgroup IA was 2.56, and in subgroup IB, 1.19 (Table 2). The number of SVPh visits in subgroup IA in the last 2 stages, which were responsible for restoring muscle strength, was 26.67, and in subgroup IB, 7.22 (Table 2). The frequency of SVPh visits in subgroup IA in the last 2 stages, which were responsible for restoring muscle strength, was 1.78, and in subgroup IB, 0.48 (Table 2). Subgroups IA and IB were not significantly different in terms of age, body weight, height, BMI, and Tegner activity scale scores but were significantly different in terms of the number of SVPh visits (Table 2).
In group A, 19 patients had a dominant right lower limb, and 1 patient had a dominant left lower limb. Nine patients from group A underwent right limb surgery, and 11 patients underwent left limb surgery. All participants in group B had a dominant right lower limb. In subgroup IA, all patients had a dominant right lower limb, and in subgroup IB, 1 patient had a dominant left lower limb, and 8 had a dominant right lower limb. In subgroup IA, 3 patients were operated on the right limb and in subgroup IB, 4 patients. The left limb was operated on in 3 patients in subgroup IA, and in 5 patients in subgroup IB (Table 2).
The sample size was estimated on the basis of 10 randomly selected results at the design stage of the study. Means and standard deviations of the results of RIT values obtained under isometric torque (0°/s) in the patients who underwent AT surgery and had the opportunity to have 47 study visits to physiotherapy (involved leg, group A) and participants in the control group (right leg, group B) were used in the analysis of estimating the sample size (the estimated sample size for a 2-sample unpaired-means test, unpaired
SURGICAL PROCEDURE:
In group A, after the unilateral rupture of the full continuity of the AT, the patients underwent surgical treatment, which consisted of an open surgical suturing of the AT via Kessler’s method [13,14].
POSTOPERATIVE PHYSIOTHERAPY:
The physiotherapeutic procedure after the surgical suturing of AT has been described in detail in a separate publication [6]. Postoperative management was divided into 5 stages: the first stage, 1 to 2 weeks after surgery; the second stage, 3 to 6 weeks after surgery; the third stage, 7 to 12 weeks after surgery; the fourth stage, 13 to 16 weeks after surgery; and the fifth stage, 17 to 28 weeks after surgery. A previous article on postoperative physiotherapy presents the characteristics of the exercises, physical procedures, manual therapy, massage, and, in particular, the therapeutic exercises adapted to the physiological basis of tissue healing [6]. The protocol of SVPh after ATSSKS, including the aforementioned variables, has a description of exercises necessary to perform at a given stage of postoperative physiotherapy and their frequency, number of series and repetitions, time of 1 repetition, intensity with which exercises should be performed, selection of loads, and rest breaks between exercises.
The main goal of the initial stage after surgery was to reduce pain and swelling of the AT and ankle joints. Isometric exercises of the muscles of the operated limb in immobilization were performed with the patients. Regular isometric exercises and isometric exercises with partial resistance were done, as were exercises for the muscles of the non-operated limb and the trunk muscles. Patients were instructed how to use a cast or brace and trained how to walk under a load of the operated limb with elbow crutches with the immobilization of the ankle joint. In the case of the additional use of a brace, cryotherapy was applied for about 2 to 3 min, laser therapy of the postoperative scar was initially applied at 4 J/cm2 with an intensity of 400 mW, and the dosing time was automatically recalculated depending on the intensity (J) and the treatment area (cm2). Low-frequency alternating magnetic field therapy was used: initially, the intensity was 20 Gs, frequency was 10 to 15 Hz, shape of the impulse was triangular, duration of the procedure lasted 20 min, and pause in the impulse was for 1.5 to 2 s. Then, the doses were increased, according to the standard methodology of conducting these treatments.
The second stage, when the brace was used, focused on supporting the tendon healing process by continuing the procedures from the previous stage. Subsequently, the physiotherapist performed the mobilization of the first degree of the postoperative scar and the triceps calf muscle. Then, passive movements of the ankle joint were performed on the continuous passive motion splint (initially in the sagittal plane). All patients performed isometric exercises and proprioception exercises with immobilization of the ankle joint, in the supine position. A gradual limb load of the operated limb and immobilization was performed. Initially, the load on the operated limb was 15% to 20% of body weight, which was gradually increased every few days. Then, about 5 weeks after the operation, exercises were introduced on a bicycle ergometer, initially without resistance and with ankle joint immobilization. Provided that the immobilization of the ankle could be removed, a massage of the foot and lower leg was performed, mobilization of the postoperative scar and selected techniques of manual therapy of soft tissues were used, including mobilization of the first degree of plantar flexion of the foot, and lymphatic drainage was performed. The angle of the foot plantar flexion in the brace was gradually reduced. The therapist applied phonophoresis with nonsteroidal drugs to reduce pain and swelling. Electrostimulation of the calf triceps muscle was performed using the bipolar method.
The third stage was to recover the total range of motion of the joint of the operated AT in all planes of movement, without the use of a brace. The patient was trained on how to perform the correct and different phases of gait. Stretching exercises and active exercises for the lower leg muscles were introduced, including for the triceps calf muscle, isometric exercises with increasing resistance of large muscle groups outside the area of the operated tendon, and body stabilization and proprioceptive stimulation, with the use of the unstable ground and opened or closed eyes. The intensity started from 20% to 25% of the load in each new exercise and was increased every 3 to 4 days by about 5% to 10%, on an individual basis.
In the fourth stage, the focus was on the patient’s gradual return to everyday life and work activities, improvement of basic locomotion, and re-education of the techniques of walking in a straight line, successively up the stairs, and on unstable ground. Exercise of pronation and supination was done with the physiotherapist making resistance of both feet. Then, the asymmetry of muscle strength between the limbs was reduced through isometric exercises with resistance, active exercises with resistance, concentric-eccentric and eccentric, and increasing the load, and gradually the intensity, of these exercises on the operated limb. Subsequently, heel rising on the toes exercises, squats, proprioception exercises with the utilization of unstable surfaces, ankle hops, running, and interval running were performed. All of the exercises were to help the patient to return to regular everyday activities, work, and sporting activities.
The fifth and last stage included exercises to increase the strength and intensity of the muscles acting on the ankle joints, joints of the lower limbs, and trunk. Subsequently, exercises for the plantar and dorsal flexor muscles of the foot in the ankle joint were performed using an isokinetic dynamometer and other stations. Then, training the strength of the muscles of the shin, as well as special exercises, including the following, were introduced: speed exercises, agility exercises, advanced level of motor coordination exercises directed to a specific sport discipline, plyometric exercises with different kinds of surfaces, like a trampoline, running at maximal speed and a different inclination of surface and changing the direction of movement, and specific exercises aimed at improving power [6]. The intensity of the exercise depended on the orientation of the physiotherapeutic visit; in the case of exercises devoted to the development of muscle power and strength, high intensity (80–90% of the load) was used with a low number of repetitions (6–8 repetitions). In the case of running and jumping exercises, the number of repetitions increased to 10 to 12, but they were performed at a lower intensity (40–60% of the load). The new exercises were performed in 2 series, and then the number of series was increased to 3. In the fourth and fifth stages, the physiotherapist changed the character of the physiotherapeutic visit every meeting from the development of muscle strength and power to visits devoted to improving running, jumping, or proprioception exercise [6]. Moreover, at each stage of physiotherapy, patients were instructed on what exercises to perform at home.
CLINICAL EXAMINATION:
Before starting the measurements of the maximal IT and PT value in groups A and B, the specialist physician performed an orthopedic examination. The physician measured pain using the 100-mm visual analogue scale (VAS). Then, to assess the stability and continuity of the AT, the physician asked the patients about the occurrence of pain, which was measured using the 100-mm VAS. The specialist physician performed the Matles test [14,15], the Thompson test [16], and palpation. The continuity of the above-mentioned structures was checked by means of ultrasound [17], which revealed no pathology.
MEASUREMENTS METHODS:
All patients and healthy participants underwent measurements of the values of the total range of motion in the sagittal plane (total ROMSP), maximal IT values obtained under maximal isometric tension (0°/s), and values of the maximal PT values under maximal isokinetic testing (30°/s and 180°/s) for the FPFM and FDFM.
Measurements of total ROMSP, IT, and PT values were performed on the Biodex Medical System 3 dynamometer station (model 333-250 Software-Biodex Advantage, Biodex Medical Systems, Shirley, NY, USA), following the methodology provided by the manufacturer [11]. Participants were asked to refrain from submaximal and maximal physical activity 24 h prior to the examination, not to use a “heavy diet” or stimulants, and to respect hygienic living conditions. The participants were dressed in sports clothes. Before the measurements, the participants performed a 12-min warm-up on a cycle ergometer. There was a 5-min break between the warm-up and the measurement [18]. After the break, the participants proceeded to the measurements of total ROMSP, IT, and PT values of the ankle joint for the FPFM and FDFM, assuming a semi-sitting position on the Biodex Medical System 3 [11]. The measurements were performed on a measuring station with the torso inclined to an angle of 70° in relation to the seat. The examined lower limb was supported and stabilized on a Biodex Medical System 3 support [11], with which the knee joint was bent to an angle of 30° and the hip joint to an angle of 70°. The examined foot was placed and stabilized in a special adapter attached to the dynamometer axis by Biodex Medical System 3 [11]. The foot was placed in the same line as the tibia and thigh. The torso, pelvis, tested lower limb, and foot were stabilized with straps, and the untested limb was stabilized with a footrest [11]. During the measurement, the participants kept their hands crossed on the chest and head resting on the chair’s headrest.
Measurement of the total ROMSP was measured in degrees (°). The patients and participants performed the maximal plantar flexion and subsequently changed the direction of movement, up to the maximal dorsiflexion of the foot in the ankle joint, in accordance with the Biodex Medical System 3 measurement methodology [11].
Measurement of the IT value of the muscles acting on the foot in the sagittal plane began with a mock measurement, which was performed twice for FPFM and FDFM, with a maximal intensity of 50% in the neutral position of 0° (the foot position of 90° in relation to the tibia). Then, the IT values for FPFM and FDFM, acting on the ankle joint in the sagittal plane, were measured, starting with the foot position in dorsiflexion, precisely at −15° dorsiflexion, then at 0°, and successively at plantar flexion in the angles of 15° and 30°, respectively. In the patients in group A, the measurement was started from the non-operated limb, and in the healthy participants in group B, from the dominant limb [11]. At the command “start”, the patients and participants performed the maximal isometric tension of a given muscle group, at the appropriate measuring angle. The measurement began with FPFM, in which they were supposed to flex their foot downward into plantar flexion at maximal muscle tension. The command “start” signaled the beginning of the measurement, and the command “stop” signaled that the measurement was completed. The duration of a single maximal isometric tension lasted 10 s. The interval between the maximal isometric tension in a given measurement angle was 10 s [11]. The measurement for each angle of the foot position in relation to the shin was performed twice for each muscle group. Before starting the IT measurement, there was a 90-s pause for the next angle of the foot position in relation to the lower leg. The transition to the next measuring angle was carried out automatically and was controlled by the Biodex Medical System 3 [11], in accordance with the above sequence of the positioning of the tested foot.
The PT value measurement was performed on the same day after a 5-min break from the completed measurement of the IT value. The position of the patients and participants on the measuring station and the choice of the measuring limb in each group were the same as for measuring the IT values for FPFM and FDFM [11]. The PT value measurement was performed in the sagittal plane for FPFM and FDFM, after prior determination of the range of motion, and was measured with the Biodex Medical System 3 dynamometer [11]. The test started with a constant angular velocity of 30°/s (4 repetitions) and 180°/s (8 repetitions), with alternating concentric phases for FPFM and FDFM, and with a 2-min interval between sets. Before starting the measurements at a given angular velocity, 2 trial sets of test repetition (mock) were performed, followed by a 10-s break, before the actual measurement test [11]. At the “start” command, the patients and participants were asked to flex the foot alternatively downward and upward into plantar flexion and dorsiflexion in the total range of motion, starting with dorsiflexion [11]. At the “stop” command, the measurement was completed. In all tests, a correction of the gravitational force was applied in accordance with the instructions of the Biodex Medical System 3 [11]. After the measurements, the results were subjected to further analysis; values were obtained for the highest maximal IT (N*m) and the highest maximal PT (N*m) for FPFM and FDFM. Each of these values was normalized per kilogram of the patients’ and participants’ body weight as the RIT value, expressed in N*m/kg, and the RPT value, expressed in N*m/kg. Measurement repeatability tests under the conditions of maximal isometric tension and isokinetic tests conducted by Webber et al indicated high intraclass correlation coefficients (ICCs) for FPFM (0.74–0.95) and FDFM (0.94–0.99), respectively, and under isokinetic test conditions for FDFM (0.89–0.98) and FPFM (0.77–0.95) [19]. Nuzo et al demonstrated the reproducibility of the measurement of the FPFM under the isokinetic test conditions, with ICCs >0.90 [20].
The circumferences of the ankle was measured with a centimeter tape, in the supine position, with the feet placed outside the couch at the height of the lateral and medial ankle. The circumference of the shin was measured at a height of 20 cm from the base of the patella, in the supine position [21].
STATISTICAL ANALYSIS:
Statistical analysis was done using Statistica 13 (TIBCO Software Inc., USA) and G*Power [22]. The following values were calculated: mean (M) and standard deviations (SD), or medians (Me) and quartiles (Q1, Q3). Then, the Shapiro-Wilk test was used to check the normality of the distribution of the examined variables. Next, the t test was performed when P>0.05 for both samples. In cases of P<0.05 for at least 1 of the trials, the Mann-Whitney U test was performed. For qualitative variables, the frequency of their occurrence (percentage) was calculated. The comparison of qualitative variables was performed using the Yates-corrected chi-square test. One-way ANOVA was used to compare the operated limb in group A to the right and left limb in group B. If the ANOVA test result was P≤0.05, a post hoc Tukey’s test was performed. Comparisons of RIT and RPT values between the groups were performed using 2-way ANOVA, along with post hoc analysis (Tukey’s test). P values ≤0.05 were considered statistically significant. In addition, the Pearson correlation (r) was calculated for the strength and direction of the linear relationship between the number of supervised physiotherapy visits and the RIT and RPT values for FPFM and FDFM, the Limb Symmetry Index (LSI), total ROMSP values, and circumference of the ankle joints and the shin. The associations were classified as follows: negligible (0.00–0.30), low (0.31–0.50), moderate (0.51–0.70), high (0.71–0.90), and very high (0.901–1.00) [23]. Comparison of the intragroup and intergroup results in subgroup IA and subgroup IB were carried out with the use of the Mann-Whitney U test with Bonferroni correction. The LSI was used in both study groups to verify the clinical significance of the RIT and RPT values. The LSI was calculated for each participant by dividing the RIT values (N*m/kg) of the operated limb by the RIT values (N*m/kg) of the non-operated limb, and then the obtained value was multiplied by 100.
The LSI index in group B was computed by dividing the RIT (N*m/kg) values of the dominant limb by the RIT (N*m/kg) values of the non-dominant limb, and then the obtained value was multiplied by 100. The LSI for RPT values was calculated in the same way as with the RIT values for group A and group B. Symmetry was indicated when the values were closer to 100, and asymmetry, when the values were above 110 [24]. Power analysis was performed for each comparison, as appropriate for the particular test (t test/ANOVA/Mann-Whitney U test). The power analysis in such research should be higher than 80% (respectively, 0.8) [25].
Results
COMPARISON OF GROUP A AND GROUP B:
The conducted analysis showed that the RIT and RPT values did not statistically significantly change, depending on the examined lower limb in group A and group B (from P=0.081 to P=0.83 for FPFM and from P=0.063 to P=0.838 for FDFM) (Table 3).
In the intergroup comparison of group A and group B, all RIT and RPT values for FPFM were significantly lower in group A (from P≤0.001 to P=0.042) (Table 3).
Comparing RIT values in group A and group B, the RIT values for an angle of 30° of FDFM (M=0.57 N*m/kg, SD=0.08 N*m/kg) were significantly lower in group A (P=0.032) (Table 3).
In addition, it was observed that the differences between the results obtained from the evaluation of the lower limbs in a given group were statistically significantly higher in group A than in group B for all RIT and RPT values for FPFM (from P≤0.001 to P=0.025), and for RIT values for FDFM at −15° (M=0.07%, SD=0.10%), 0° (M=0.07%, SD=0.08%) angles (from P=0.002 to P=0.011) (Table 3).
When comparing the LSI values between group A and group B, all RIT and RPT values for FPFM were statistically significantly lower in group A (from P≤0.001 to P=0.014) (Table 3). Comparing the LSI between group A and group B, the RIT values for FDFM at 0° (M=88.93 N*m/kg, SD=12.17 N*m/kg), 15° (M=93.50 N*m/kg, SD=10.22 N*m/kg), and 30° (M=91.34 N*m/kg, SD=9.18 N*m/kg) angles were statistically significantly lower in group A than in group B (from P=0.001 to P=0.024) (Table 3). The power analysis of the test of FPFM results ranged from 44% to 100% (Table 3). The power analysis of the test of FDFM results ranged from 14% to 100% (Table 3).
Based on the variance analysis, as shown in Table 4, RIT values in group A were significantly lower than the right and left lower limbs in group B for FPFM, at angles of −15° (M=1.69 N*m/kg, SD=0.61 N*m/kg), 0° (M=1.24 N*m/kg, SD=0.44), 15° (M=0.74 N*m/kg, SD=0.35 N*m/kg), 30° (M=0.34 N*m/kg, SD=0.21 N*m/kg) (P≤0.001; Table 4), and FDFM, at a 30° angle (M=0.57 N*m/kg, SD=0.08 N*m/kg, P=0.019; Table 4). Tukey’s test revealed that RIT values for FPFM in the operated limb in group A in comparison to the right and left lower limbs in group B, at angles of −15°, 0°, 15°, and 30°, were significantly lower (P≤0.001, Table 4). The power analysis of the results ranged from 11% to 100% (Table 4).
Patients in group A and healthy participants in group B reported being pain-free using the VAS scale, positive Matles test, and Thompson’s test.
RANGE OF MOTION, CIRCUMFERENCES OF THE ANKLE JOINT AND THE SHIN OF GROUP A AND GROUP B:
In the intragroup comparison of the operated limb with the non-operated limb and the right with left limb in both studied groups, there were no statistically significant differences in the values of total ROMSP, circumferences of the ankle joints, and circumference of the shin (from P=0.078 to P=0.775; Table 5). In the intergroup studies of group A and group B, statistically significantly higher differences were observed between the lower limbs in group A than in the lower limbs in group B, to the disadvantage in group A for the values of total ROMSP (M=6.88% SD=6.92%), circumference of shin (M=−0.37%, SD=0.48%), and circumference of ankle joints (M=1.13%, SD=0.99%) (P<0.001, Table 5). The power analysis of the test ranged from 12% to 100% (Table 5).
ANALYSIS OF CORRELATION IN GROUP A:
The results revealed positive and moderate correlations between a higher number of visits and higher values of RIT for FPFM in the operated lower limb at the −15° angle (r=0.503, P=0.024), LSI for RPT values at 30°/s for FPFM (r=0.506, P=0.023), and RIT values for FPFM at the 15° angle for the non-operated limb (r=0.504, P=0.024) and for the not operated limb in the measuring angle of 30° (r=0.585, P=0.007; Table 6).
Also, there was a positive and weak correlation noted between a higher number of SVPh visits and higher RIT values for FPFM of the operated limb at 0° (r=0.448, P=0.047) and 15° (r=0.476, P=0.034), non-operated limb for FDFM at the 0° angle (r=0.465, P=0.039), LSI for the RIT value at the 30° angle (r =0.470, P=0.036), and LSI for the RPT value for FPFM of 180°/s (r=0.444, P=0.05; Table 6).
There was a negative and moderate correlation between a higher number of SVPh visits and a lower RIT value for the FDFM of the non-operated lower limb at the 0° angle (r=−0.508, P=0.039; Table 6).
There was no correlation between the number of visits and the values of total ROMSP, circumference of the ankle joints, and circumference of the shin.
ANALYSIS IN SUBGROUPS IA AND IB:
In the intragroup comparison between the operated and non-operated limbs in subgroup IA, no RIT and RPT values were statistically significantly different for FPFM and FDFM (P=0.692 to P=1.00; Table 7). In subgroup IB, statistically significantly lower RIT values occurred at the angles of 15° (Me=0.53 N*m/kg; Q1=0.34 N*m/kg; Q3=0.70 N*m/kg) and 30° (Me=0.28 N*m/kg; Q1=0.16 N*m/kg; Q3=0.32 N*m/kg). There were lower RPT values of 180°/s (Me=0.46 N*m/kg Q1=0.37 N*m/kg; Q3=0.56 N*m/kg) in the operated limb for FPFM than in the non-operated lower limb (from P=0.016 to P=0.05; Table 7).
In the intergroup comparison of the operated limbs of subgroups IA and IB, there were no statistically significant differences in the RIT and RPT values for FPFM and FDFM (from P=0.064 to P=1; Table 7). Comparing the non-operated limbs of subgroup IA with those of IB, there were significantly lower RIT values for FPFM at the 30° angle (Me=0.41 N*m/kg; Q1=0.39 N*m/kg; Q3 =0.45 N*m/kg, P=0.012) in subgroup IB, and for FDFM, there were no statistically significant differences between subgroup IA and IB (P=0.156 to P=1.00; Table 7). The LSI of the RIT values for FPFM at −15° (Me=77.12 N*m/kg; Q1=60.73 N*m/kg; Q3=93.31 N*m/kg, P=0.05) and the RPT values at 180°/s (Me=64.38 N*m/kg; Q1=60.84 N*m/kg; Q3=81.28 N*m/kg, P=0.022) and 30°/s (Me=72.91 N*m/kg; Q1=65.95; N*m/kg; Q3=81.40 N*m/kg; P=0.049) were statistically significantly lower in subgroup IB than in subgroup IA. There were no significant differences in the LSI for RIT and RPT values for FDFM between the IA and IB subgroups (from P=0.112 to P=0.860; Table 7).
Moreover, the differences between the results obtained from the assessment of the lower limbs were statistically significantly higher in subgroup IB than in subgroup IA for RPT values of 180°/s (Me=0.22 N*m/kg; Q1=0.17 N*m/kg; Q3=0.28 N*m/kg, P=0.029) and 30°/s (Me=0.37 N*m/kg; Q1=0.31 N*m/kg; Q3=0.57 N*m/kg, P=0.05) for FPFM (Table 7). The power analysis of the test results of FPFM between subgroups ranged from 6% to 92% (Table 7). The power analysis of the test results of FDFM between subgroups ranged from 5% to 65% (Table 7). The power analysis of the test results of FPFM between legs in subgroup IA ranged from 10% to 54% and in subgroup IB, from 44% to 91% (Table 7). The power analysis of the test results of FDFM between legs for FDFM in subgroup IA ranged from 7% to 22%, and in subgroup IB, from 8% to 69% (Table 7).
RANGE OF MOTION, CIRCUMFERENCES OF THE ANKLE JOINT AND SHIN OF SUBGROUPS IA AND IB:
In comparing the values of total ROMSP, ankle joint circumference, and shin circumference values of the operated leg between subgroups IA and IB, no statistically significant differences were found (from P=0.864 to P=1.00; Table 8). In the intragroup comparisons of subgroups IA and IB, the values of total ROMSP, ankle joint circumference, and shin circumferences values of the operated and non-operated limbs, no statistically significant differences were observed (from P=0.188 to P=1.00; Table 8). The power analysis of the test results between the subgroups ranged from 6% to 22% (Table 8). The power analysis of the test of results between legs in subgroup IA ranged from 11% to 30% and in subgroup IB, from 7% to 37% (Table 8).
Discussion
In response to the objective of the study, we noted that conducting a retrospective study from one center in Poland of 47 postoperative SVPh visits in the studied group after ATSSKS with a frequency of 1.7 per week conducted for 28 weeks after surgery did not allow the operated AT side to fully restore the RIT values of the plantar flexion muscles of the foot, in relation to the non-operated side and compared with the results obtained in the group without AT injuries.
The conducted research confirmed the hypothesis that the higher number, frequency, and intensity of postoperative supervised physiotherapy visits after ATSSKS correlated with and had an impact on obtaining higher and more symmetrical RIT and RPT values of the plantar flexor muscles of the foot.
In both studied groups, the results of the Matles and Thompson tests were negative. The VAS scale indicated no pain. Total ROMSP values, circumference of the ankle joints, and circumference of the shin of the operated limb differed between the groups to the disadvantage of group A, with ATSSKS, in comparison with group B, without AT injuries.
In turn, subgroup IA had an average of twice as many visits during the 28 weeks of physiotherapy than did subgroup IB during the same time. In the last 2 stages of SVPh, subgroup IA had a 3-times higher frequency and number of visits than did subgroup IB. This resulted in higher and more symmetrical RIT and RPT values for FPFM and FDPM in subgroup IA than in subgroup IB. Therefore, it seems not only that the early introduction of postoperative physiotherapy was important, but also that the total number and frequency of 2-h visits each week during a uniform supervised physiotherapy protocol may have been crucial to obtaining a higher level of IT and PT values for FPFM and FDPM in patients after ATSSKS. It should also be noted that patients in subgroup IA, according to the detailed description of the SVPh protocol [6], had a significantly higher number and frequency of visits; therefore, in the last 2 stages of the SVPh, patients were subjected to considerably greater intensity of specialized exercises, with gradual higher loads on muscles and of the entire locomotor system. They also performed exercises with a larger scale of difficulty of motor coordination and movement intensity [6]. Czamara et al 2021 confirmed that conducting SVPh with an average number of 74.1 visits and with an average frequency of 3.13 of visits per week for 6 months after anterior cruciate ligament reconstruction resulted in similar RIT and RPT values of the extensor muscles and lower leg flexors between the operated knee joints and the non-operated side [26]. However, it is difficult to directly compare the results obtained in patients after anterior cruciate ligament reconstruction with the results obtained in patients after ATSSKS. On the other hand, in the available literature, we could compare this area of research only in relation to the current research. We hope that the presented research problem will interest other scientists to devote more attention to this issue.
The reduced values of the IT and PT of the plantar-flexors muscles of the foot after the surgical suturing of AT can generate a higher risk of knee joint damage, change in gait quality, and greater knee joint moments and joint reaction forces and influence static balance control ability [27,28]. Don et al observed that patients after AT surgical suture using an open method achieved symmetry of PT value of the plantar-flexion muscles of the foot 12 months after the treatment [29]. Orishmo et al found that persistently lower IT values of the plantar flexor muscles of the foot at the angle of 20° occurred in the 43rd month after an open surgical suturing of AT [30]. In the present study, patients in group A after AT surgical suture using an open method obtained lower IT values in the operated limb in all measured angles for FPFM, but the muscles’ value in the isokinetic test conditions did not differ significantly for the operated leg compared with that of the lower limbs of the control group.
In the study by Lantto et al, the analysis of the results of the IT and PT values for FPFM, at a distant date from the applied AT suturing, showed that even 11 years after the surgical AT suturing, the values of the maximal IT for FPFM in the operated limbs were not similar to the values obtained in the non-operated limb under isokinetic test conditions; however, under the conditions of the maximal isometric tension, these parameters equalized after the first year of surgery [31]. On the other hand, Horstmann et al published results which showed that 10 years after the application of AT surgical suture using an open method, there were still significantly higher differences in the PT values for FPFM to the disadvantage of the operated limb, and the differences in PT values for the operated limb of FDFM were significantly reduced [32]. Christensen et al ascertained that the problem may be in the description of resistance exercises in the first 2 months of postoperative physiotherapy after AT suturing [33]. Nilsson-Hellander et al presented a protocol for postoperative physiotherapy that begins 8 weeks after surgery and included meetings under the supervision of a physiotherapist 2 to 3 times a week [34]. Porter et al published a procedure for postoperative physiotherapy, detailing the use of individual exercises up to 12 weeks after surgery [35]. In 2007, Czamara presented the current protocol of SVPh, which in the first week after surgical suturing of AT sets the course of action, including a description of the performance of particular types of exercises, number of repetitions, series, and dosing method. Similarly, it describes physical therapy, manual therapy, and recommendations for the patient to perform additional exercises at home [6]. In addition, with the completion of each stage of SVPh, the patient had a follow-up visit with their attending physician. Sikorski et al showed that SVPh conducted by a physiotherapist with a larger number of visits resulted in obtaining statistically significantly higher values of the vertical component of the ground reaction forces during one-legged and both-legged jumps in patients after surgical suturing of AT [10]. Follak et al noted significantly lower PT values of the plantar flexion muscles of the foot in the isokinetic test 2 years after AT surgical suture using an open method [36]. Follak et al performed 5 weeks of outpatient physiotherapy 3 times a week, with 2 h in 1 session, aimed at increasing the strength of the triceps calf muscle in the operated limb. After therapy completion, they reported a significant improvement in the PT value of the studied muscle groups [36].
There were limitations in the present study. The study was conducted in a single center, included a small number of patients, and bias may have been introduced into the study design. We did not screen women after ATSSKS; therefore differences in sex were not measured. Further studies should conduct postoperative supervised physiotherapy on a larger number of patients, followed by a subsequent screening of women after ATSSKS and compare the sex differences in such research. Another limitation of this research was the low values of the power test, especially in the subgroups. In addition, the authors conducted the research relatively early after the surgery; therefore, in the future, the research should be performed at an extended period after surgery. Moreover, we did not collect the patients’ opinion about their treatment assessment, not only by asking them about pain but also by using various scales to assess the return to daily life, work, and sports after ATSSKS. In future research, we intend to use at least one of the available scales, such as the American Orthopedic Foot and Ankle Society, Victorian Institute of Sports Assessment Achilles Score, or other scales [7].
In subsequent studies, it would be necessary to determine the minimum and the final number of visits and their weekly frequency and to even more precisely describe the selection of the intensity of therapeutic exercises during SVPh [6] in order to obtain the optimal IT and PT values for FPFM between the operated and non-operated lower limbs. It would also be necessary to compare the obtained results with a control group.
In the future, research should also address the impact of SVPh on the values of biomechanical parameters of running, running with maximal speed, and changing direction of movement [37,38]. The problem seems to be crucial, because up to 1 year after AT surgical suture using an open method, the symmetry of the RIT and RPT triggered by the shank muscles can be restored [39], which may help the orthopedic physician, physiotherapist, and patient make decisions about the number of supervised visits. The authors emphasize that the problem has not been resolved and that more research is needed.
Conclusions
In this retrospective observational study from a single center in Poland, we conducted 47 visits of SVPh, with a frequency of 1.7 visits per week over 28 weeks. ATSSKS did not allow for the operated side to fully restore the RIT values and RPT values of the plantar flexion muscles of the foot in the ankle joint.
We confirmed the hypothesis that a higher number, frequency, and intensity of SVPh after ATSSKS correlated with and had a positive influence on obtaining higher RIT values and RPT values of FPFM on the operated side.
Tables
Table 1. The Tegner activity scale.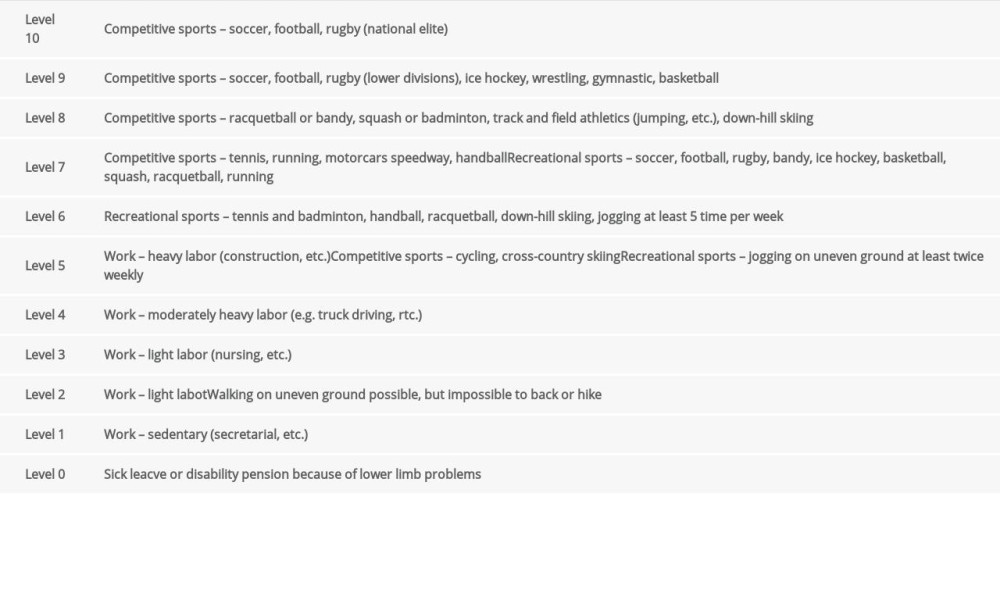 Table 2. The between-group comparison of the values corresponding to age, body mass, body height, body mass index, Tegner activity scale, duration of postoperative physiotherapy, number of postoperative physiotherapy sessions, dominant side, operated side.
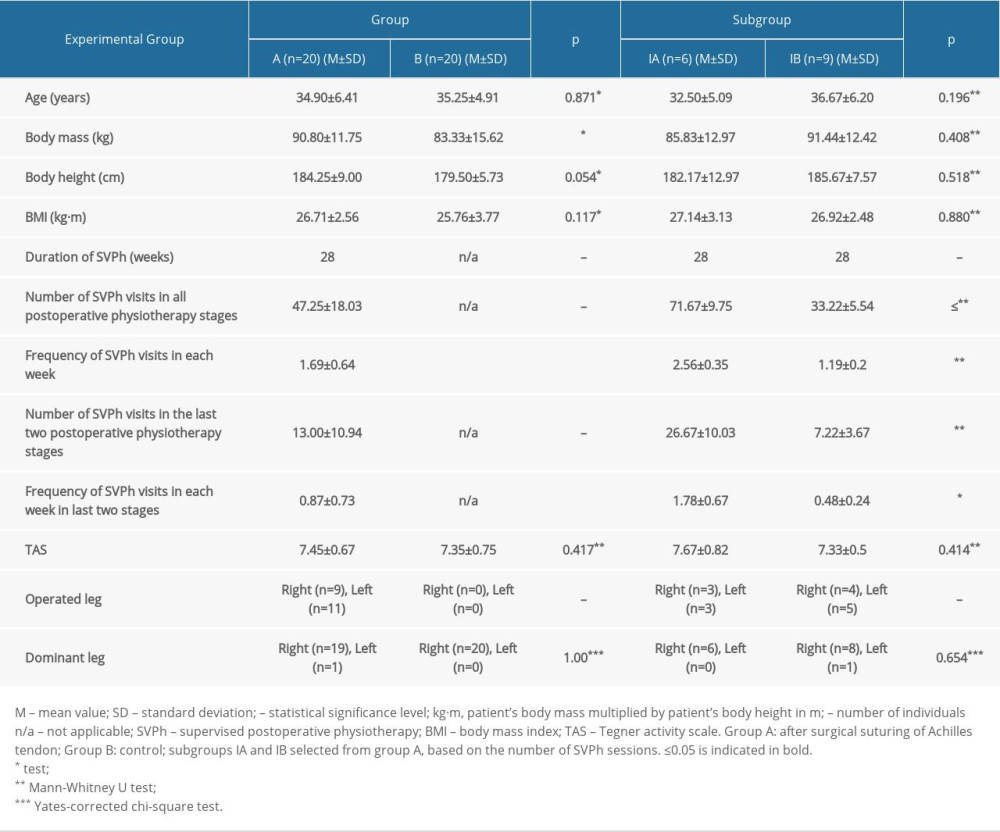 Table 3. Comparison of the intragroup and intergroup values of the relative isometric and peak torque values and their Limb Symmetry Index scores in group A and group B.
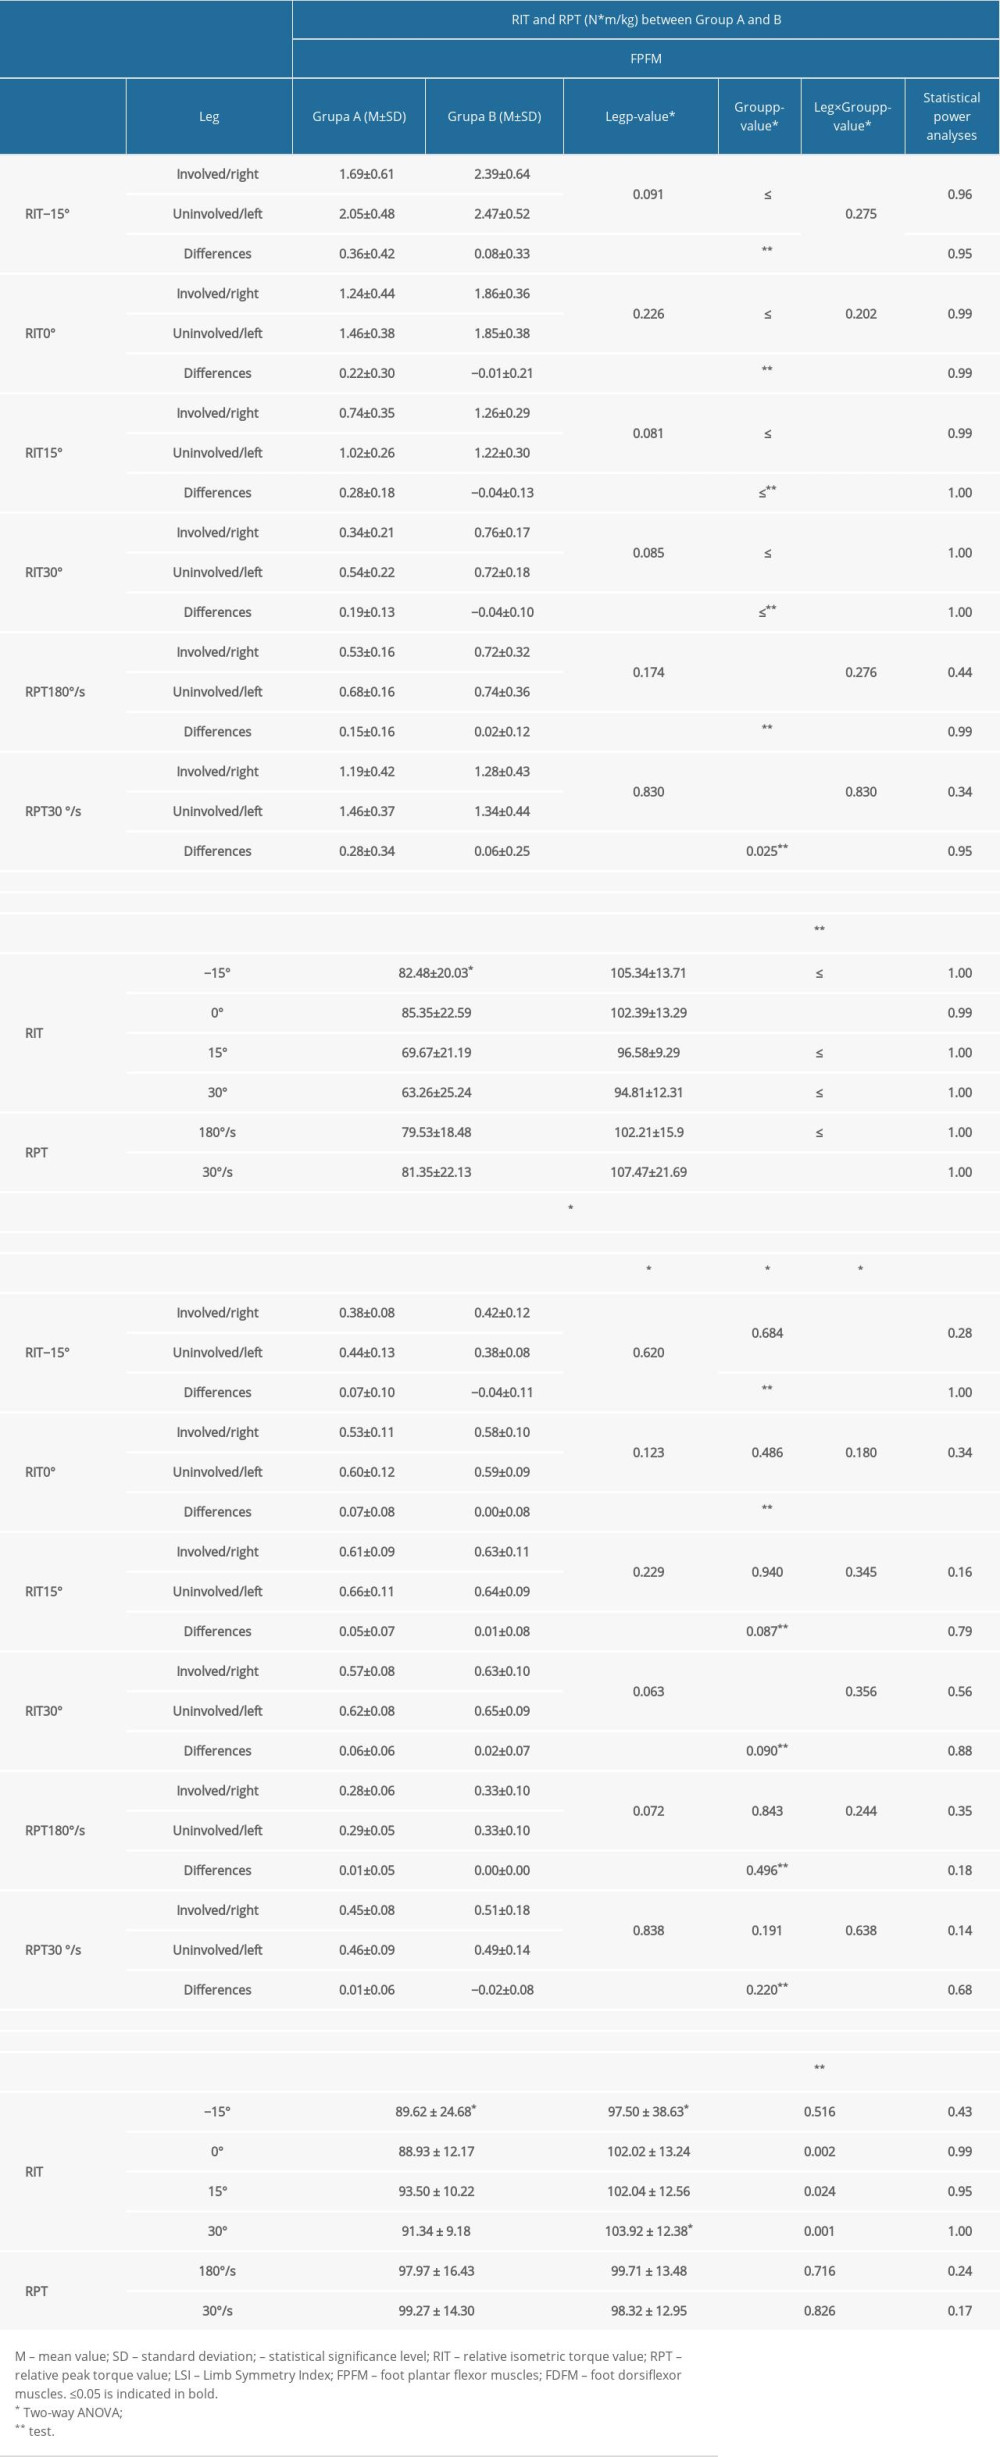 Table 4. Intergroup comparison of relative isometric and peak torque values of the ankle joint.
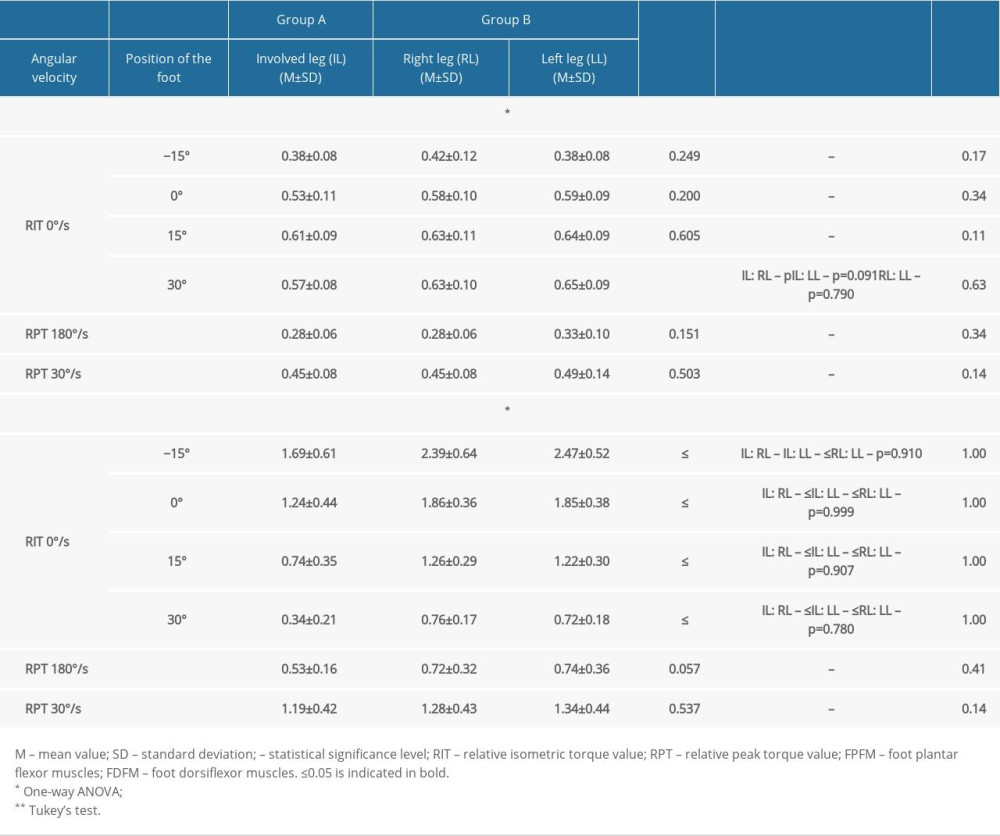 Table 5. Comparison of the intragroup and intergroup values corresponding to total range of motion in the sagittal plane, circumference of ankle joint, shin pain, and Thompson and Matles test results.
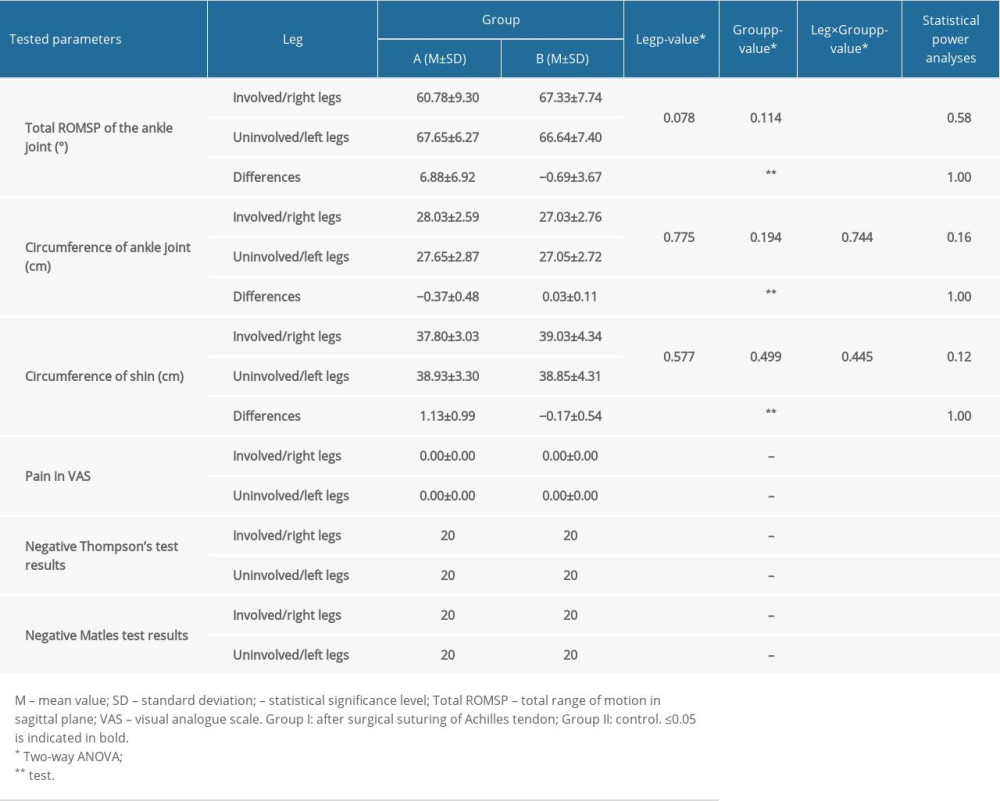 Table 6. Correlation between the number of postoperative physiotherapy visits in all stages of supervised postoperative physiotherapy after surgical suturing of the Achilles tendon to the obtained relative isometric and peak torque values, total range of motion in sagittal plane values, and circumference of ankle joint and shin values in group A.
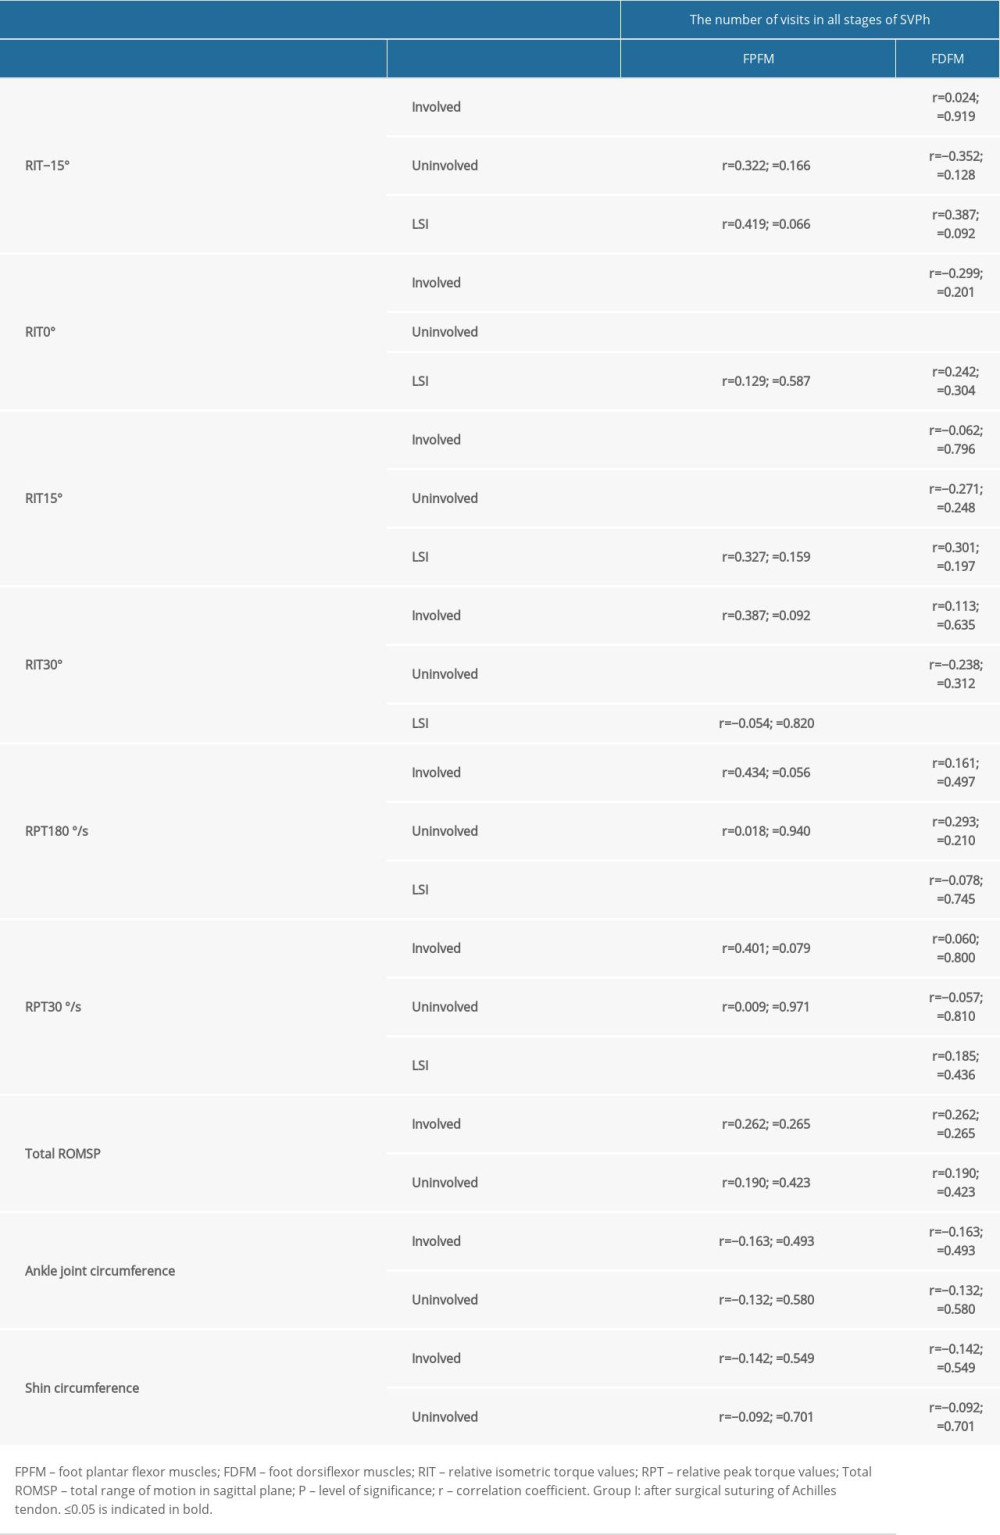 Table 7. Comparison of the intragroup and intragroup values of the relative isometric and peak torque values and their Limb Symmetry Index scores in subgroup IA and subgroup IB.
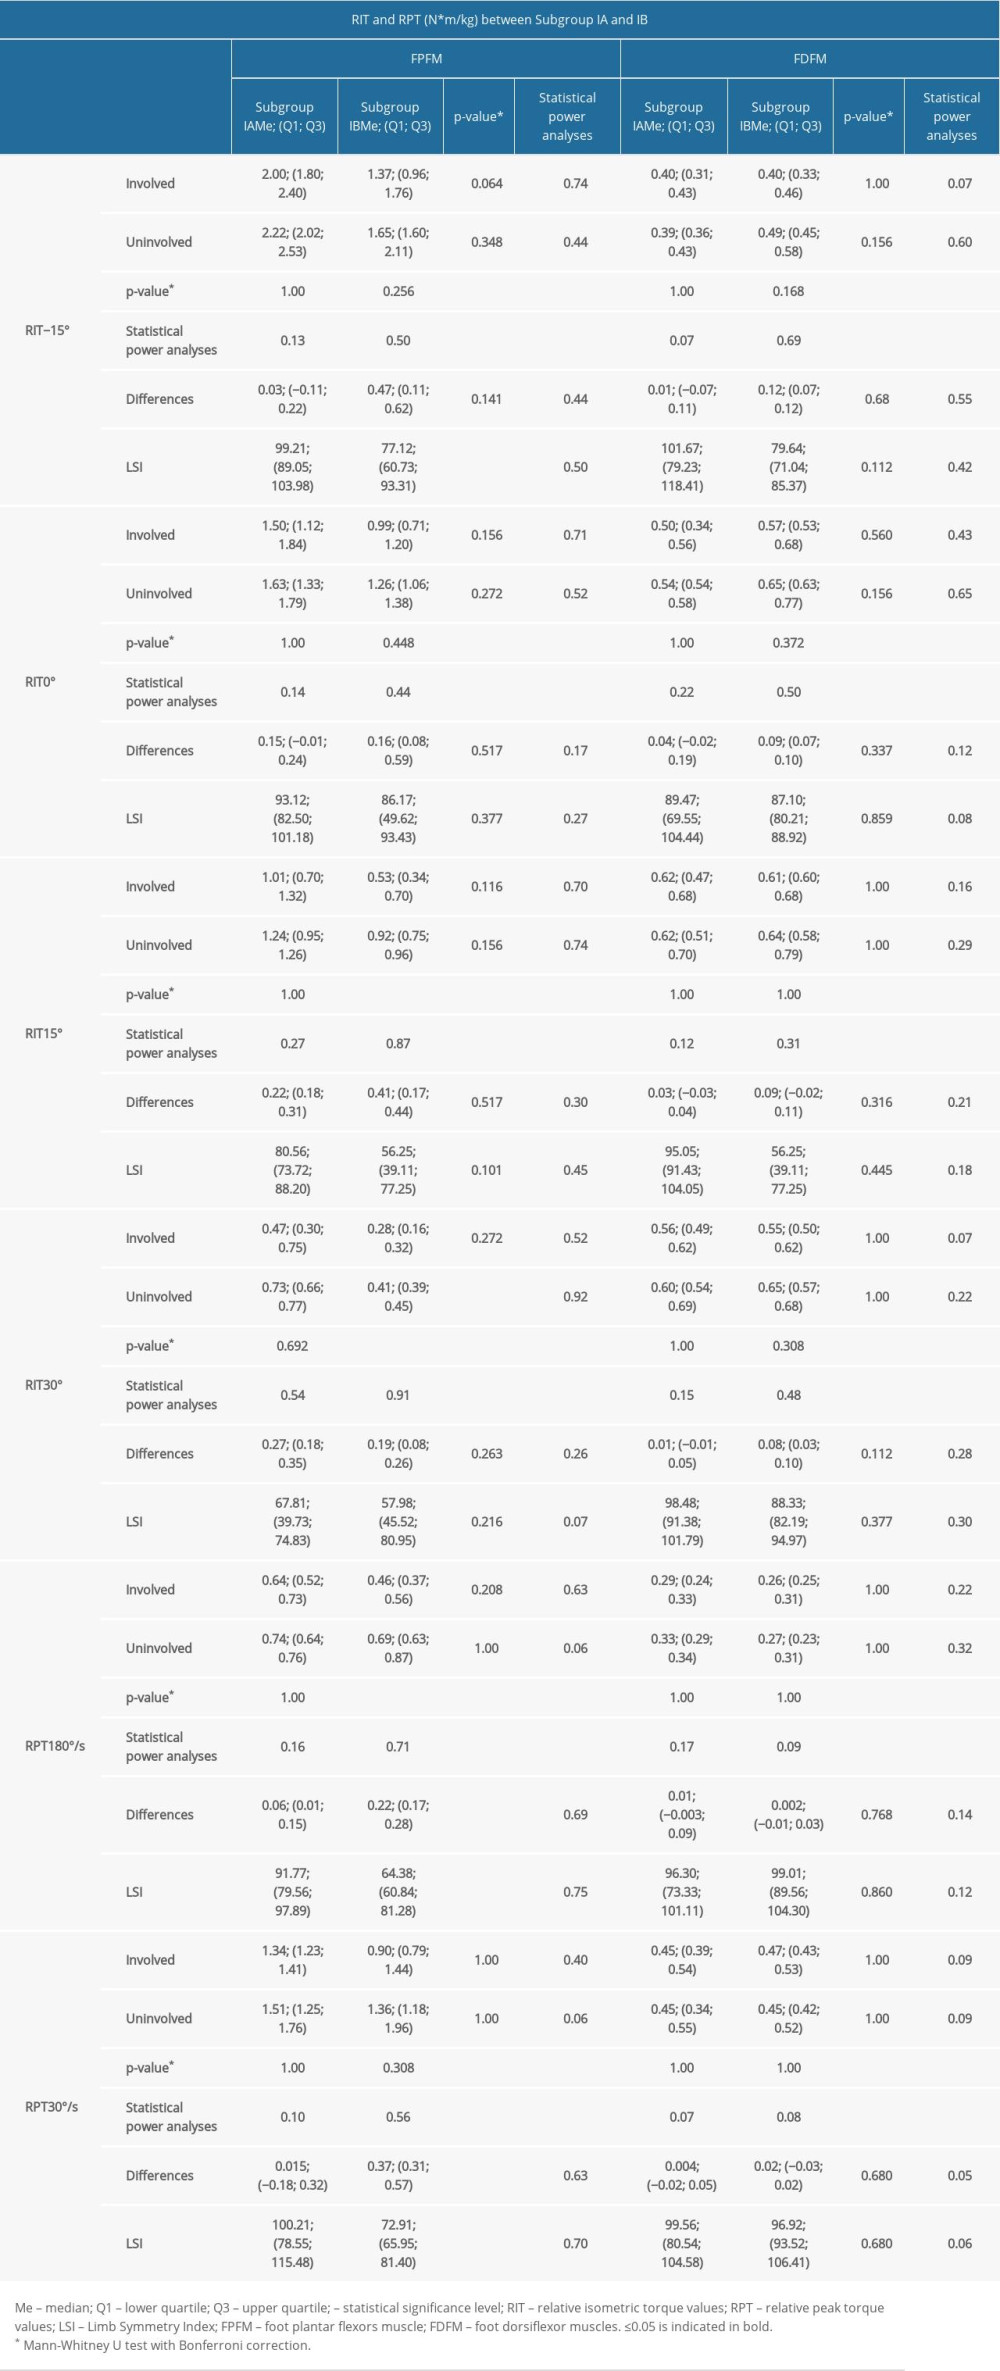 Table 8. Comparison of the intragroup and intergroup values corresponding to a total range of motion in sagittal plane (Total ROMSP) and circumference of shin and ankle joint in subgroups IA and IB.
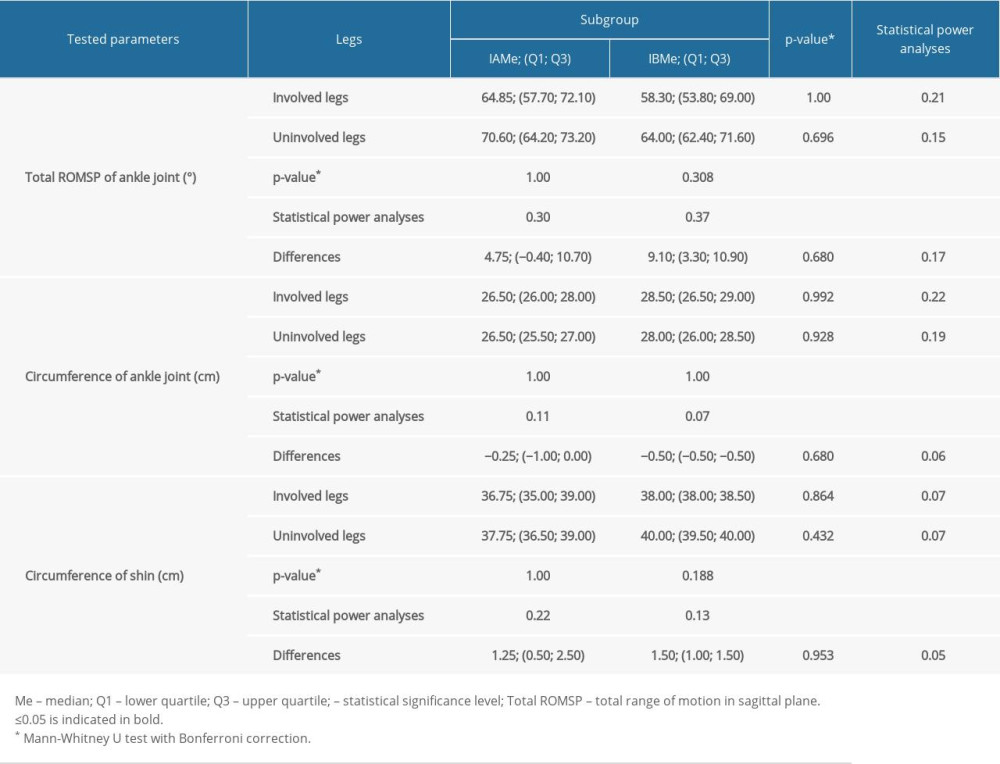
References
1. Rosenzweig S, Azar FM, Open repair of acute Achilles tendon ruptures: Foot Ankle Clin, 2009; 14(4); 699-709
2. Jallageas R, Bordes J, Daviet JC, Evaluation of surgical treatment for ruptured Achilles tendon in 31 athletes: Orthop Traumatol Surg Res, 2013; 99(5); 577-84
3. Holzgrefe RE, McCarthy TP, Wilson JM, Association of strength following Achilles tendon repair with return to same level of play in high-level athletes: Foot Ankle Int, 2020; 41(9); 1041-48
4. Huang J, Wang C, Ma X, Rehabilitation regimen after surgical treatment of acute Achilles tendon ruptures: A systematic review with meta-analysis: Am J Sports Med, 2015; 43(4); 1008-16
5. Hussain SJ, Frey-Law L, 3D strength surfaces for ankle plantar- and dorsi-flexion in healthy adults: An isometric and isokinetic dynamometry study: J of Foot and Ankle Res, 2016; 9; 1-10
6. Czamara A, Physiotherapeutic treatments after surgery of total Achilles tendon rupture: J Orthop Trauma Surg Relat Res, 2007; 1; 75-93
7. Calder JD, Saxby TS, Early, active rehabilitation following mini-open repair of Achilles tendon rupture: A prospective study: Br J Sports Med, 2005; 39(11); 857-59
8. Strom AC, Casillas MM, Achilles tendon rehabilitation: Foot and Ankle Clin, 2009; 14; 773-82
9. Czamara A, Sikorski Ł, Supervised physiotherapy improves three-dimensional (3D) gait parameters in patients after Surgical Suturing of the Achilles Tendon Using an Open Method (SSATOM): J Clin Med, 2022; 11(12); 3335
10. Sikorski Ł, Czamara A, Ground reaction forces during vertical hops are correlated with the number of supervised physiotherapy visits after Achilles tendon surgery: J Clin Med, 2021; 10; 5299
11. : Biodex advantage software, operations manual (version 3.29 and 3.30), 2008, New York, Biodex Medical Systems, Inc
12. Ebert JR, Edwards P, Yi L, Strength and functional symmetry is associated with postoperative rehabilitation in patients following anterior cruciate ligament reconstruction: Knee Surg Sports Traumatol Arthrosc, 2018; 26; 2353-61
13. Henríquez H, Muñoz R, Carcuro G, Bastías C, Is percutaneous repair better than open repair in acute Achilles tendon rupture?: Clin Orthop and Relat Res, 2012; 470(4); 998-1003
14. Sebastin SJ, Ho A, Karjalainen T, Chung KC, History and evolution of the Kessler repair: J Hand Surg, 2013; 38; 552
15. Biz C, Cerchiaro M, Belluzzi E, Bragazzi NL, Long term clinical-functional and ultrasound outcomes in recreational athletes after Achilles tendon rupture: Ma and Griffith versus Tenolig: Medicina (Kaunas), 2021; 57(10); 1073
16. Somford MP, Hoornenborg D, Wiegerinck JI, Are you positive that the Simmonds-Thompson test is negative? A historical and biographical review: J Foot Ankle Surg, 2016; 55; 682-83
17. Liu W, Zhuang H, Shao D, High-frequency color Doppler ultrasound in diagnosis, treatment, and rehabilitation of Achilles tendon injury: Med Sci Monit, 2017; 23; 5752-59
18. Czamara A, Emilianowicz M, Markowska I, Biomechanics assessment of long term consequences of talocrural joint sprain in conservatively treated males: Acta Bioeng Biomech, 2013; 15; 73-81
19. Webber SC, Porter MM, Reliability of ankle isometric, isotonic, and isokinetic strength and power testing in older women: Phys Ther, 2010; 90(8); 1165-75
20. Nuzzo JL, Taylor JL, Gandevia SC, CORP: Measurement of upper and lower limb muscle strength and voluntary activation: J Appl Physiol (1985), 2019; 126(3); 513-43
21. Sikorski Ł, Czamara A, Assessment of effectiveness of 15 weeks of physical therapy on biplanar ankle mobility, gait and pain level in patients following operative repair of the Achilles tendon: Ortop Traumatol Rehabil, 2021; 23; 33-44
22. Faul F, Erdfelder E, Lang AG, Buchner A, G*Power 3: A flexible statistical power analysis program for the social, behavioral, and biomedical sciences: Behav Res Methods, 2007; 39(2); 175-91
23. Mukaka MM, Statistics corner: A guide to appropriate use of correlation coefficient in medical research: Malawi Med J, 2012; 24(3); 69-71
24. Krzemińska K, Czamara A, Diagnostic value of the hamstring to quadriceps ratio in monitoring of the effectiveness of supervised 6-month physiotherapy in males after Anterior Cruciate Ligament Reconstruction (ACLR): Acta Bioeng Biomech, 2020; 22(4); 31-39
25. Nordenholm A, Senorski EH, Westin O, Surgical treatment of chronic Achilles tendon rupture results in improved gait biomechanics: J Orthop Surg Res, 2022; 17(1); 67
26. Czamara A, Krzemińska K, Widuchowski W, Dragan SL, The muscle strength of the knee joint after ACL reconstruction depends on the number and frequency of supervised physiotherapy visits: Int J Environ Res Public Health, 2021; 18(20); 10588
27. Sun D, Fekete G, Baker JS, A pilot study of musculoskeletal abnormalities in patients in recovery from a unilateral rupture-repaired Achilles tendon: Int J Environ Res Public Health, 2020; 17(13); 4642
28. Kim SG, Kim WS, Effect of ankle Range of Motion (ROM) and lower-extremity muscle strength on static balance control ability in young adults: A regression analysis: Med Sci Monit, 2018; 24; 3168-75
29. Don R, Ranavolo A, Cacchio A, Relationship between recovery of calf-muscle biomechanical properties and gait pattern following surgery for Achilles tendon rupture: Clin Biomech (Bristol, Avon), 2007; 22(2); 211-20
30. Orishimo KF, Schwartz-Balle S, Tyler TF, Can weakness in end-range plantar flexion after Achilles tendon repair be prevented?: Orthop J Sports Med, 2018; 6(5) 2325967118774031
31. Lantto I, Heikkinen J, Flinkkila T, Early functional treatment versus cast immobilization in tension after Achilles rupture repair: results of a prospective randomized trial with 10 or more years of follow-up: Am J Sports Med, 2015; 43(9); 2302-9
32. Horstmann T, Lukas C, Merk J, Deficits 10-years after Achilles tendon repair: Int J Sports Med, 2012; 33(6); 474-79
33. Christensen M, Zellers JA, Kjær IL, Resistance exercises in early functional rehabilitation for Achilles tendon ruptures are poorly described: A scoping review: J Orthop Sports Phys Ther, 2020; 50(12); 681-90
34. Nilsson-Helander K, Grävare Silbernagel K, Thomeé R, Acute Achilles tendon rupture: A randomized, controlled study comparing surgical and nonsurgical treatments using validated outcome measures: Am J Sports Med, 2010; 38(11); 2186-93
35. Porter MD, Shadbolt B, Randomized controlled trial of accelerated rehabilitation versus standard protocol following surgical repair of ruptured Achilles tendon: ANZ J Surg, 2015; 85; 373-77
36. Follak N, Dirk AE, Ae G, The utility of gait analysis in the rehabilitation of patients after surgical treatment of Achilles tendon rupture: Eur J Orthop Surg Traumatol, 2002; 12; 90-95
37. Królikowska A, Sikorski Ł, Czamara A, Reichert P, Effects of postoperative physiotherapy supervision duration on clinical outcome, speed, and agility in males 8 months after anterior cruciate ligament reconstruction: Med Sci Monit, 2018; 24; 6823-31
38. Czamara A, Evaluation of physiotherapeutic procedures after ACL reconstruction in males: Arch Budo, 2010; 6; 73-81
39. Olsson N, Nilsson-Helander K, Karlsson J, Major functional deficits persist 2 years after acute Achilles tendon rupture: Knee Surg Sports Traumatol Arthrosc, 2011; 19(8); 1385-93
Tables
Table 1. The Tegner activity scale.Table 2. The between-group comparison of the values corresponding to age, body mass, body height, body mass index, Tegner activity scale, duration of postoperative physiotherapy, number of postoperative physiotherapy sessions, dominant side, operated side.Table 3. Comparison of the intragroup and intergroup values of the relative isometric and peak torque values and their Limb Symmetry Index scores in group A and group B.Table 4. Intergroup comparison of relative isometric and peak torque values of the ankle joint.Table 5. Comparison of the intragroup and intergroup values corresponding to total range of motion in the sagittal plane, circumference of ankle joint, shin pain, and Thompson and Matles test results.Table 6. Correlation between the number of postoperative physiotherapy visits in all stages of supervised postoperative physiotherapy after surgical suturing of the Achilles tendon to the obtained relative isometric and peak torque values, total range of motion in sagittal plane values, and circumference of ankle joint and shin values in group A.Table 7. Comparison of the intragroup and intragroup values of the relative isometric and peak torque values and their Limb Symmetry Index scores in subgroup IA and subgroup IB.Table 8. Comparison of the intragroup and intergroup values corresponding to a total range of motion in sagittal plane (Total ROMSP) and circumference of shin and ankle joint in subgroups IA and IB.Table 1. The Tegner activity scale.Table 2. The between-group comparison of the values corresponding to age, body mass, body height, body mass index, Tegner activity scale, duration of postoperative physiotherapy, number of postoperative physiotherapy sessions, dominant side, operated side.Table 3. Comparison of the intragroup and intergroup values of the relative isometric and peak torque values and their Limb Symmetry Index scores in group A and group B.Table 4. Intergroup comparison of relative isometric and peak torque values of the ankle joint.Table 5. Comparison of the intragroup and intergroup values corresponding to total range of motion in the sagittal plane, circumference of ankle joint, shin pain, and Thompson and Matles test results.Table 6. Correlation between the number of postoperative physiotherapy visits in all stages of supervised postoperative physiotherapy after surgical suturing of the Achilles tendon to the obtained relative isometric and peak torque values, total range of motion in sagittal plane values, and circumference of ankle joint and shin values in group A.Table 7. Comparison of the intragroup and intragroup values of the relative isometric and peak torque values and their Limb Symmetry Index scores in subgroup IA and subgroup IB.Table 8. Comparison of the intragroup and intergroup values corresponding to a total range of motion in sagittal plane (Total ROMSP) and circumference of shin and ankle joint in subgroups IA and IB. In Press
06 Mar 2024 : Clinical Research
Comparison of Outcomes between Single-Level and Double-Level Corpectomy in Thoracolumbar Reconstruction: A ...Med Sci Monit In Press; DOI: 10.12659/MSM.943797
21 Mar 2024 : Meta-Analysis
Economic Evaluation of COVID-19 Screening Tests and Surveillance Strategies in Low-Income, Middle-Income, a...Med Sci Monit In Press; DOI: 10.12659/MSM.943863
10 Apr 2024 : Clinical Research
Predicting Acute Cardiovascular Complications in COVID-19: Insights from a Specialized Cardiac Referral Dep...Med Sci Monit In Press; DOI: 10.12659/MSM.942612
06 Mar 2024 : Clinical Research
Enhanced Surgical Outcomes of Popliteal Cyst Excision: A Retrospective Study Comparing Arthroscopic Debride...Med Sci Monit In Press; DOI: 10.12659/MSM.941102
Most Viewed Current Articles
17 Jan 2024 : Review article
Vaccination Guidelines for Pregnant Women: Addressing COVID-19 and the Omicron VariantDOI :10.12659/MSM.942799
Med Sci Monit 2024; 30:e942799
14 Dec 2022 : Clinical Research
Prevalence and Variability of Allergen-Specific Immunoglobulin E in Patients with Elevated Tryptase LevelsDOI :10.12659/MSM.937990
Med Sci Monit 2022; 28:e937990
16 May 2023 : Clinical Research
Electrophysiological Testing for an Auditory Processing Disorder and Reading Performance in 54 School Stude...DOI :10.12659/MSM.940387
Med Sci Monit 2023; 29:e940387
01 Jan 2022 : Editorial
Editorial: Current Status of Oral Antiviral Drug Treatments for SARS-CoV-2 Infection in Non-Hospitalized Pa...DOI :10.12659/MSM.935952
Med Sci Monit 2022; 28:e935952