10 October 2022: Database Analysis
Activation of Tumor-Associated Macrophages via Promotes Recurrence of Oral Squamous Cell Carcinoma
Chen-xi Li123ABCDEF, Ying Su4ABCD, Zhong-cheng Gong123ACDG*, Hui Liu56ACDDOI: 10.12659/MSM.937126
Med Sci Monit 2022; 28:e937126


Abstract
BACKGROUND: Oral squamous cell carcinoma (OSCC) is the most common head and neck malignancy, characterized by high recurrence rate resulting in poor prognosis. Porphyromonas gingivalis, most closely correlated with chronic periodontitis, is increasingly thought to play a significant role in OSCC development via influencing tumor-associated macrophages. However, its specific function remains unclear. In this study, we attempted to explore the mechanism of action of P. gingivalis in the recurrence of OSCC by bioinformatics analysis, to lay a foundation for subsequent basic experiments.
MATERIAL AND METHODS: The P. gingivalis-infected macrophage microarray dataset (GSE24897) and the OSCC advanced relapse patient microarray dataset (GSE87593) were retrieved from the Gene Expression Omnibus (GEO) database. Differentially-expressed genes (DEGs) were screened using R system, and the intersected DEGs were analyzed for functional enrichment, and protein–protein interaction (PPI) networks were constructed. The expression of significant DEG in GSE24897 microarray was assessed to determine its effect on macrophage immune infiltration in pan-cancer by applying the TIMER 2.0 repository. To detect the expression of DOK3 in OSCC specimens, immunohistochemical (ICH) assay was used.
RESULTS: A total of 106 co-expressed DEGs were upregulated and 131 were downregulation. The biological processes were mainly enriched in DNA-templated transcription terms, the cellular component enrichment was mainly enriched in the nucleus terms, and the molecular function enrichment was mainly enriched in protein-binding function terms. Kyoto Encyclopedia of Genes and Genomes (KEGG) analysis found that the DEGs were mainly enriched in the MAPK signaling pathway. Overall analysis of the PPI network showed a significant aggregation, with the top 10 hub co-expressed genes (CASP3, FYN, HNRNPA2B1, NR3C1, RELA, REL, POLR2F, RAN, RHOA, and STAT5B). DOK3 is significantly upregulated in P. gingivalis-infected macrophages, which is associated with macrophage infiltration and differentiation. There was more positive DOK3 staining in the group with P. gingivalis infection.
CONCLUSIONS: P. gingivalis can affect the recurrence of OSCC by increasing the expression of DOK3 in TAMs, which may be involved in activation of signaling pathways such as TNF and MAPK.
Keywords: DOK3 Protein, Human, Macrophage Activation, Neoplasm Recurrence, Local, Porphyromonas gingivalis, Squamous Cell Carcinoma of Head and Neck, tumor microenvironment, Adaptor Proteins, Signal Transducing, Biomarkers, Tumor, Carcinoma, Squamous Cell, Caspase 3, Computational Biology, DNA, Gene Expression Profiling, Gene Expression Regulation, Neoplastic, Gene Regulatory Networks, Head and Neck Neoplasms, Humans, Mouth Neoplasms, Tumor-Associated Macrophages
Background
Cancer of the oral cavity has a high recurrence and high staging at diagnosis, which often does not allow surgical treatment because the interventions are too destructive and have secondary complications; therefore, the treatment of choice is chemoradiotherapy [1]. Oral squamous cell carcinoma (OSCC) is the most common subgroup of head and neck malignancies, which can develop in all parts of the oral cavity, resulting directly from apparently normal mucosa or progressively from potentially malign disorders [2]. Annually, there are around 400 000 new cases diagnosed all across the globe, accounting for 2% of all cancers [3]. Patients with advanced OSCC have poor prognosis due to strong invasive ability, high recurrence rate, and lymph node metastasis [4]. Locoregional recurrence is frequent (approximately 32.7~44.9%) [5–7] and remains a critical issue in clinical management of advanced-stage OSCC [8].
Increased attention has focused on the interaction between oral microbiome and OSCC in the past few decades [9]. The accumulated evidence indicates that chronic periodontitis is one of the pathogenic factors resulting in OSCC [10–13], which was found to increase the incidence of OSCC by 5.23-fold [14]. Microbiota homeostasis plays important roles in health and disease. Dysbiosis of oral florae can disrupt the host immune defense, thus deeply affecting tumorigenesis [15,16].
Tumor-associated macrophages indeed are among the most plentiful and important tumor-infiltrating immune cell types in TME. They have great plasticity in function, which can present diverse phenotypes to act within distinct microenvironments based on their biogenesis and biological properties [27]. According to different regulatory signals and states, macrophages can be categorized into 2 polarizations: classical activation type (M1 type) and alternative activation type (M2 type) [28]. More importantly, the pro-tumor effects of TAMs have strong links with their M2 polarized phenotype [29,30]. The downstream of kinase (
Herein, we hypothesized that
Material and Methods
ETHICS:
Our study was reviewed and approved by the Ethics Committee at the First Affiliated Hospital of Xinjiang Medical University, Urumqi, PR China (approval number: K202107-06). Procedures in this research were completed in keeping with the standards of the Helsinki Declaration and laboratory guidelines of research in China. Written informed consent was not applicable.
DATA PREPARATION:
To screen the datasets related to
DIFFERENTIALLY-EXPRESSED GENE ANALYSIS:
The 2 datasets were separately analyzed using the Limma package in R software version 4.0.2 (R Foundation for Statistical Computing, Vienna, Austria). The probes without corresponding gene symbols or with multiple gene symbols were removed or taken as intersection. The differentially-expressed genes (DEGs) were screened and heat-mapped using the R heatmap package. Accordingly, differences were considered statistically significant with logFC (fold change) >1 and adj.
FUNCTIONAL ANNOTATIONS ANALYSIS:
We employed DAVID (Database for Annotation, Visualization and Integrated Discovery) (
PROTEIN–PROTEIN INTERACTION ANALYSIS:
The DEGs were enrolled in a protein–protein interaction (PPI) network through the STRING database (
MACROPHAGE INFILTRATION:
We used the TIMER 2.0 online tool (
COLLECTION OF CLINICAL SAMPLES:
Fifty patients with recurrent OSCC admitted to our center from January 2020 to June 2022 were selected for the study, of whom 27 were males and 23 were females, aged 55~75 years. All patients were tested for P. gingivalis before enrollment (the detection method for P. gingivalis is shown in Supplementary Figure 1), of which 25 were P. gingivalis-positive and 25 were P. gingivalis-negative. All patients in this study voluntarily participated and signed the informed consent form. There was no significant difference between the 2 groups in terms of general information such as sex and age (P>0.05). The use of human samples in this study was approved by our center’s Ethics Committee and was performed according to the STROBE (Strengthening the Reporting of Observational Studies in Epidemiology) statement.
HISTOPATHOLOGICAL EVALUATION:
Fresh OSCC tissues excised during clinical procedures were placed in 4% formaldehyde solution for fixation, and then were dehydrated, paraffin-embedded, and serially sectioned to 4-μm thickness. The sections were dewaxed in xylene; hydrated in ethanol with gradients of 100%, 95%, 90%, and 85% for 5 min each. Antigen repair was performed with 10 mmol/L sodium citrate buffer for 15 min, washed 3 times with PBS after natural cooling, and reacted with peroxidase blocker for 15 min to block endogenous peroxidase, then washed 3 times with PBS and incubated with goat serum. Sections were incubated with DOK3 monoclonal antibody (Abcam, ab236609, 1: 500) and incubated overnight at 4°C in a refrigerator. After rewarming for 2~5 min, goat anti-rabbit IgG was added after washing with PBS and incubated at room temperature for 25 min, then washed 3 times with PBS, and horseradish peroxidase-labeled streptavidin working solution was added for 15 min. After washing 3 times with PBS, the DAB kit (Beyotime, Shanghai, China) was used for 3~5 min; hematoxylin was used for restaining, 1% hydrochloric acid alcohol fractionation for 1~2 s, and water was used to return the blue. After natural drying, 10% neutral gum was used to seal the film. Double-blind scoring was performed by 2 professional pathologists. Eight fields of view per section were randomly selected for observation at 200× and 400×.
STATISTICAL ANALYSIS:
All data-mining work was performed using the packages Limma (Version 3.46.0) [38], MethylMix (Version 2.20.0) [39], clusterProfiler (Version 4.3.1) [40], survminer (Version 0.4.9), survival (Version 3.2.13), glmnet (Version 4.1.2) [41], pheatmap (Version 1.0.12), corrplot (Version 0.90), timeROC (Version 0.4) [42], WGCNA (Version 1.70.3) [43], maftools (Version 2.6.5) [44], and pRRophetic (Version 0.5) implemented in R software, version 4.0.2 (R Foundation for Statistical Computing, Vienna, Austria). When measurement data were normally distributed, data were expressed by mean±standard deviation (SD), and an independent samples t test was used for comparison of 2 groups, while the chi-square test was used for comparison of count data. For all analyses, two-tailed P<0.05 was set as the threshold for determining statistical significance. Differences were considered significant if * P<0.05; ** P<0.01; *** P<0.001, **** P<0.0001.
Results
IDENTIFICATION OF DEGS:
After normalizing the expression profile of sequencing data, the distributions of differential gene expression between 2 samples were visualized using volcano plots (Figure 1A, 1B). A total of 747 differentially-expressed genes were identified in the GSE24897 dataset, including 496 upregulated genes and 251 downregulated genes (Figure 1C), while 747 differentially-expressed genes were identified in the GSE87593 dataset, including 226 upregulated genes and 521 downregulated genes (Figure 1D). Posterior to taking the intersection of the 2 collections, there were 106 genes in common among all upregulated genes (Figure 2A) and 131 genes in common among all downregulated genes (Figure 2B).
FUNCTIONAL ANALYSIS OF DEGS:
To understand the biological meaning behind lists of DEGs, enrichment analysis of signaling pathways and functions was performed using DAVID (Table 1). Biological processes (BP) were mainly enriched in DNA-templated transcription terms (Figure 3A), the cellular component (CC) enrichment was mainly enriched in the nucleus terms (Figure 3B), and molecular function (MF) enrichment was mainly enriched in protein-binding function terms (Figure 3C). KEGG enrichment analysis found that the genes were predominantly enriched in the MAPK signaling pathway (Figure 3D).
THE PPI NETWORK OF THE CO-EXPRESSION OF DEGS:
The co-expression of DEGs was imported into the online STRING Data Resources to derive the PPI network, which showed a total of 225 nodes and 232 edges. After hiding the isolated nodes in the network, 198 expected nodes remained, with a PPI enrichment P value of 0.0108. The overall analysis of the network showed a significant aggregation (Figure 4). Using cyto-Hubba software package, all the proteins in PPI network were calculated by applying maximum correntropy criterion (MCC) algorithm, which displaying that the top 10 ranked genes were CASP3, FYN, HNRNPA2B1, NR3C1, RELA, REL, POLR2F, RAN, RHOA, and STAT5B (Figure 5).
THE RELATIONSHIP BETWEEN DOK3 EXPRESSION AND MACROPHAGE INFILTRATION:
To investigate the effect of DOK3 expression on macrophage infiltration, we first analyzed the expression of DOK3 in P. gingivalis infection of macrophages microarray. The analysis revealed that the expression of DOK3 significantly increased after macrophages were treated with P. gingivalis (Figure 6A, P<0.0001). The effect of DOK3 on macrophage infiltration was further analyzed, showing that expression of DOK3 affected the infiltration of M1 and M2 TAMs in oral cancer (Figure 6B, P<0.05).
:
To confirm the expression of DOK3 in patients with different P. gingivalis infections, we collected oral cancerous tissues from patients with recurrent OSCC through clinical biopsy and divided the patients into P. gingivalis-infected and non-infected groups by P. gingivalis detection. The expression of DOK3 in 2 groups was detected by immunohistochemistry (ICH), and the results showed that the DOK3 staining was stronger in the group with P. gingivalis infection than in the group without P. gingivalis infection (Figure 7).
Discussion
LIMITATIONS:
The present study is a bioinformatics analysis based on data provided by a public database (GEO), and although we found high expression of
Conclusions
Our study shows the participation of
Figures
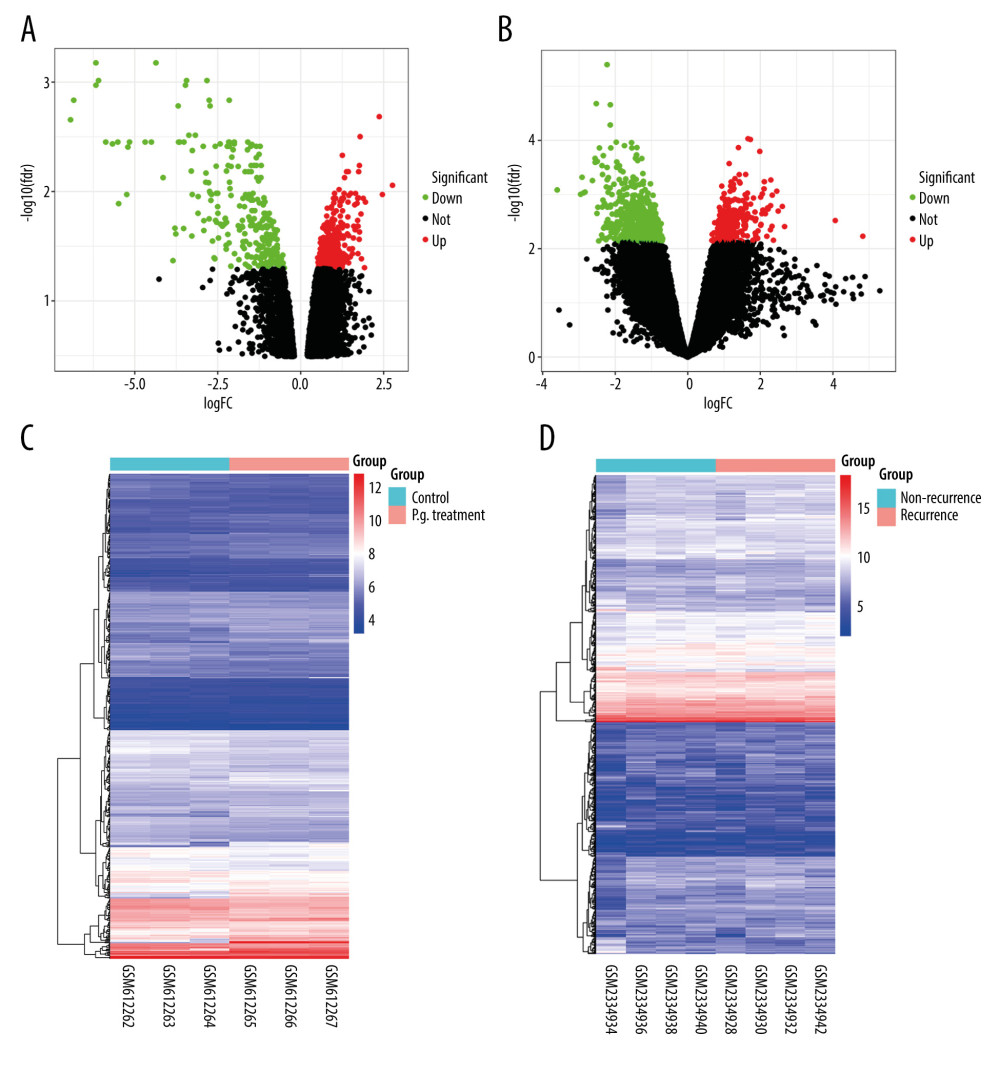 Figure 1. Distributions of differentially-expressed genes.(A, B) The volcano plot of GSE24897 and GSE85793. Green dots represent significantly downregulated genes, red dots represent significantly upregulated genes, and black dots represent insignificantly changed genes. (C, D) The heatmaps of DEGs. Blue color represents low expression genes, red color represents high expression genes, and different color brightness represents gene expression. R software 4.1.3 version was used for visualization.
 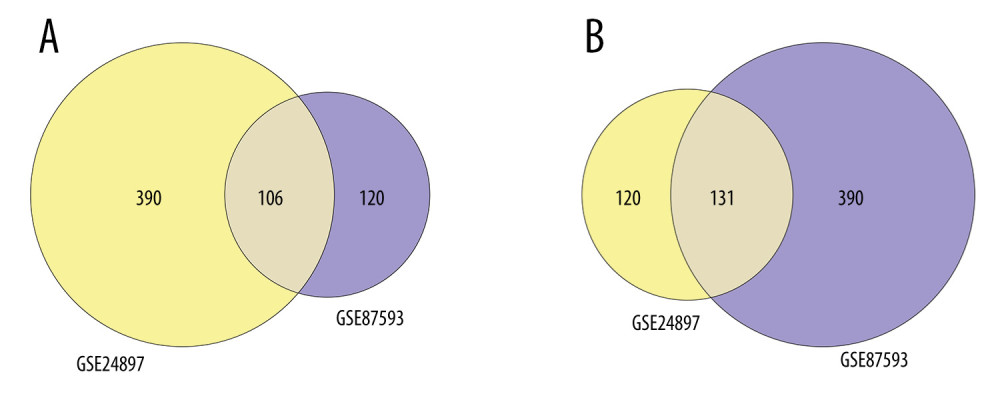 Figure 2. Venn plots of differentially-expressed genes (DEGs).Venn plots of DEGs showing upregulated (A) and downregulated genes (B). R software 4.1.3 version was used for visualization.
 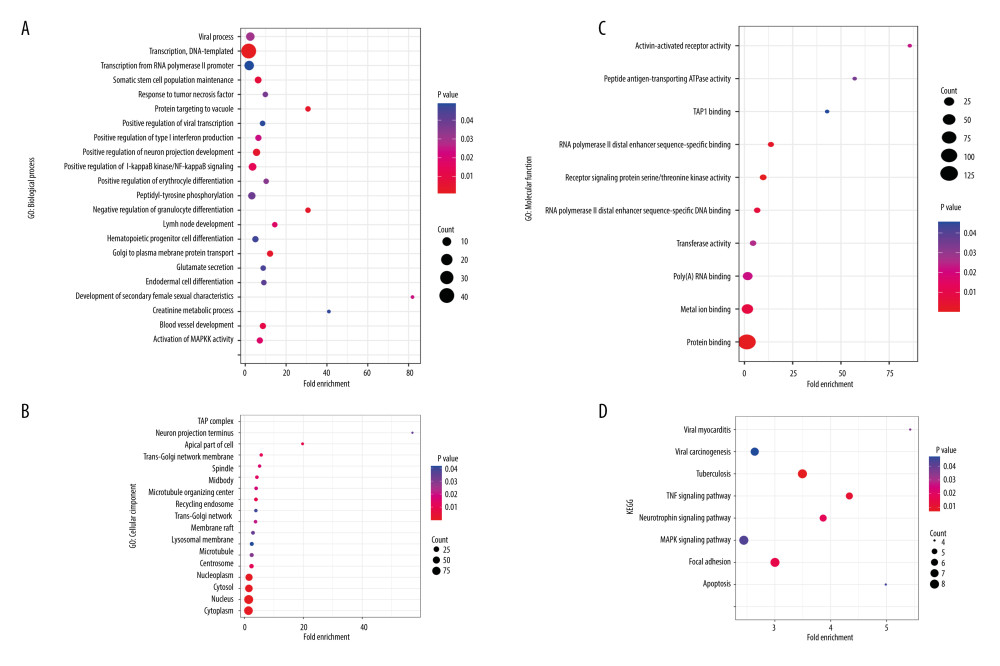 Figure 3. The GO and KEGG analysis.The significant enrichment terms in (A) BP, (B) CC, and (C) MF were shown using a scatter plot. The significant pathways involved in (D) KEGG enrichment was shown using a scatter plot. Colors represent the P values and sizes of the spots represent the counts of genes. R software 4.1.3 version was used for visualization.
 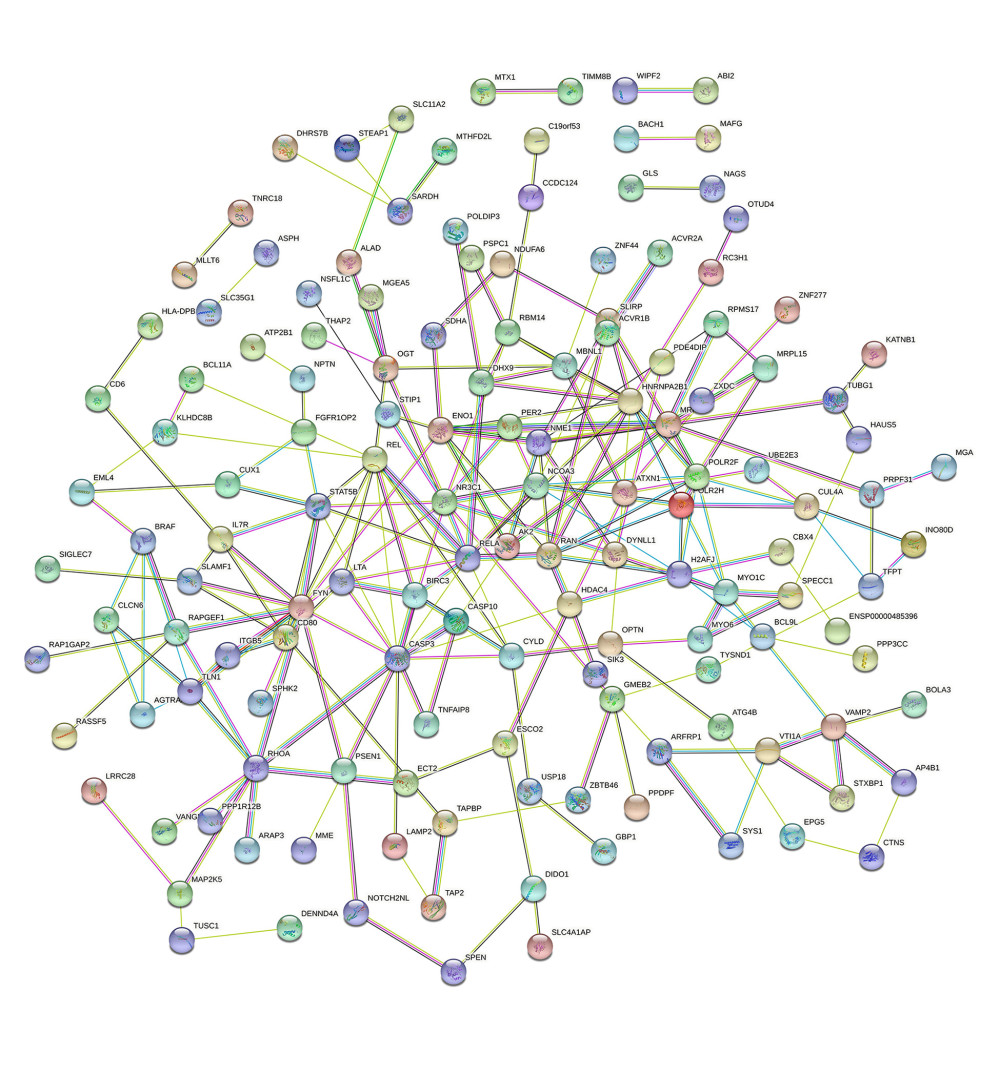 Figure 4. The PPI network.A network of protein–protein interactions (PPI) was built using STRING. Different nodes represent different proteins and the edges represent the degree of connection between proteins. String version 11.5 was used for visualization.
 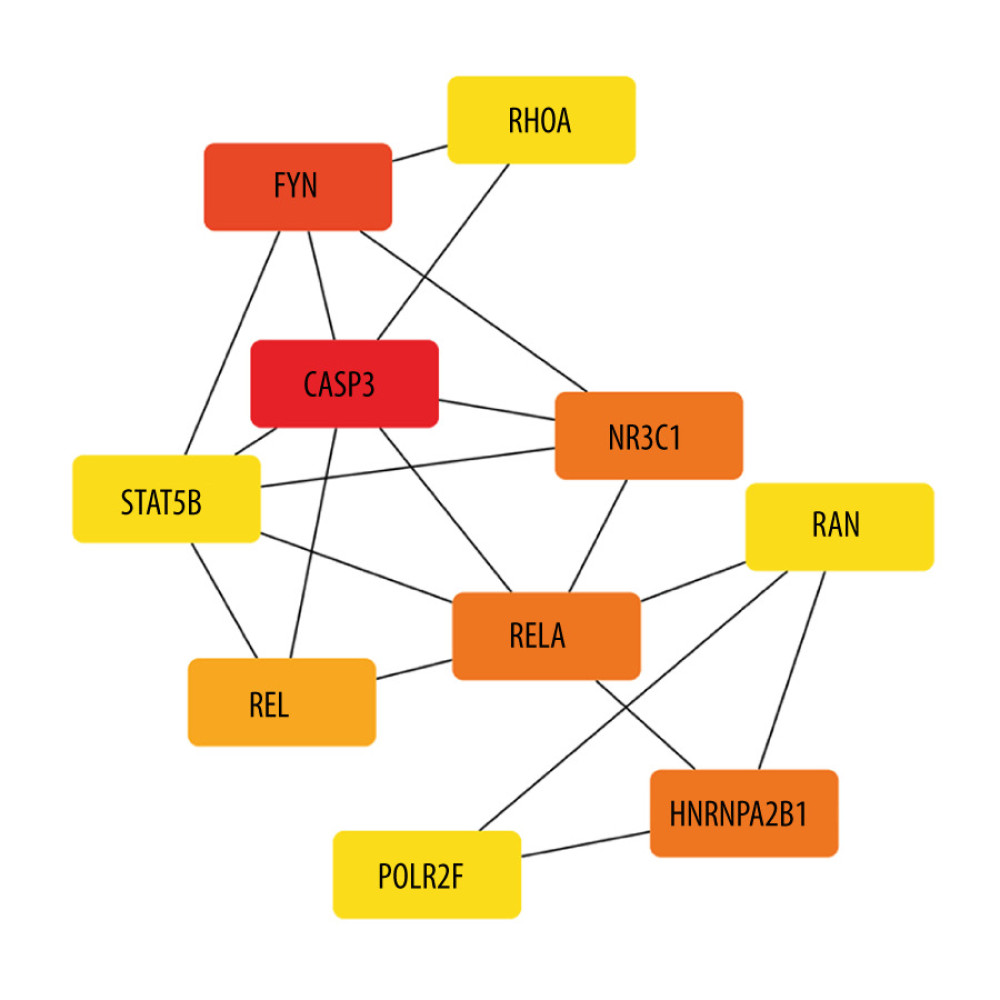 Figure 5. Hub genes computed by MCC algorithm.The top 10 hub genes were obtained by the MCC algorithm. Cytoscape version 3.9.0 was used for visualization.
 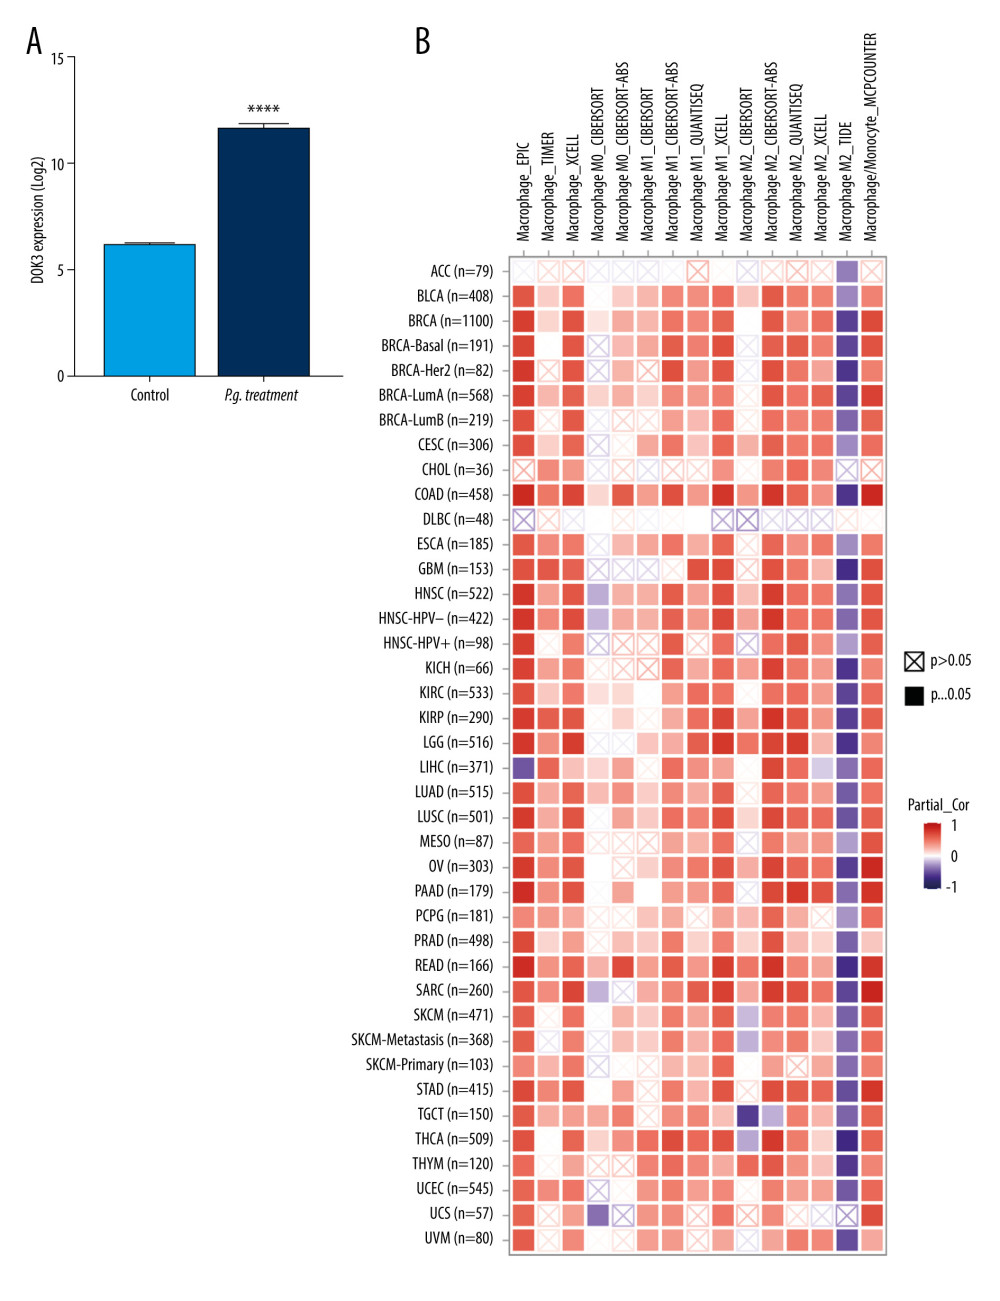 Figure 6. The relationship between DOK3 expression and macrophage infiltration. (A) The DOK3 expression in P. gingivalis infection of macrophages microarray; (B) macrophages infiltration affected by DOK3. GraphPad Prism 8 was used for visualization in Figure 5A, and the TIMER 2.0 online tool was used for visualization in Figure 5B.
 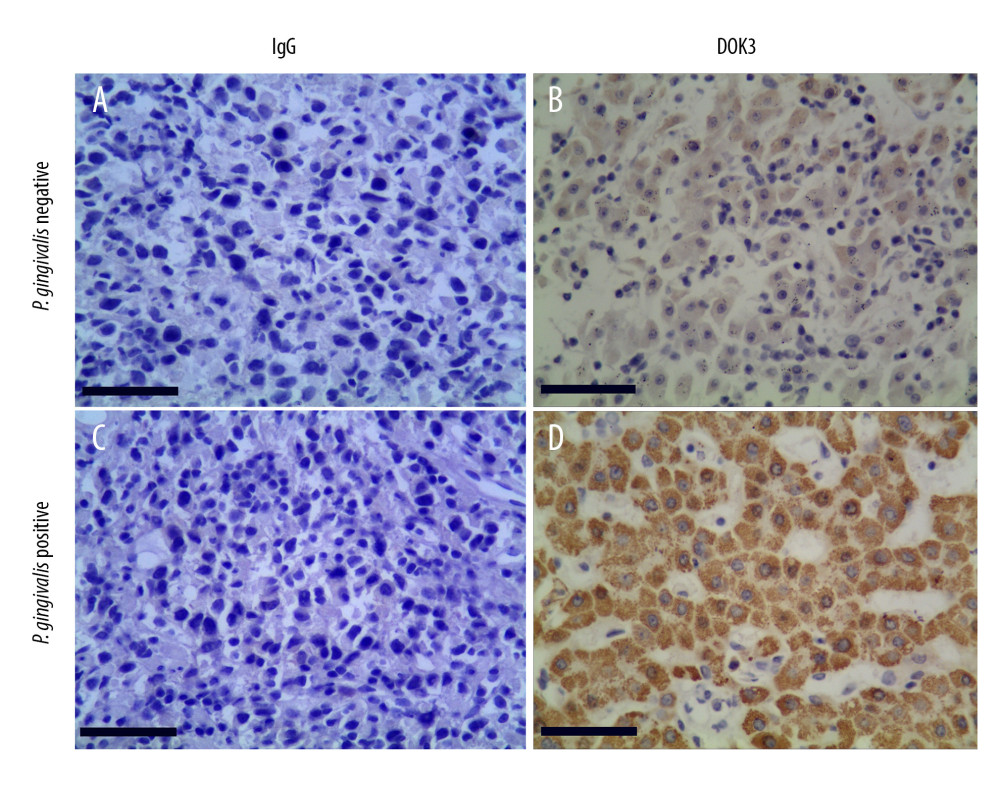 Figure 7. The expression of DOK3 in recurrent OSCC patients with differentP. gingivalis infections (B and D, 200×) compared with non-immune IgG staining as a control (A and C, 200×).The yellow-stained granules represent DOK3 staining-positive cells, and the larger yellow staining area represents higher DOK3 expression.
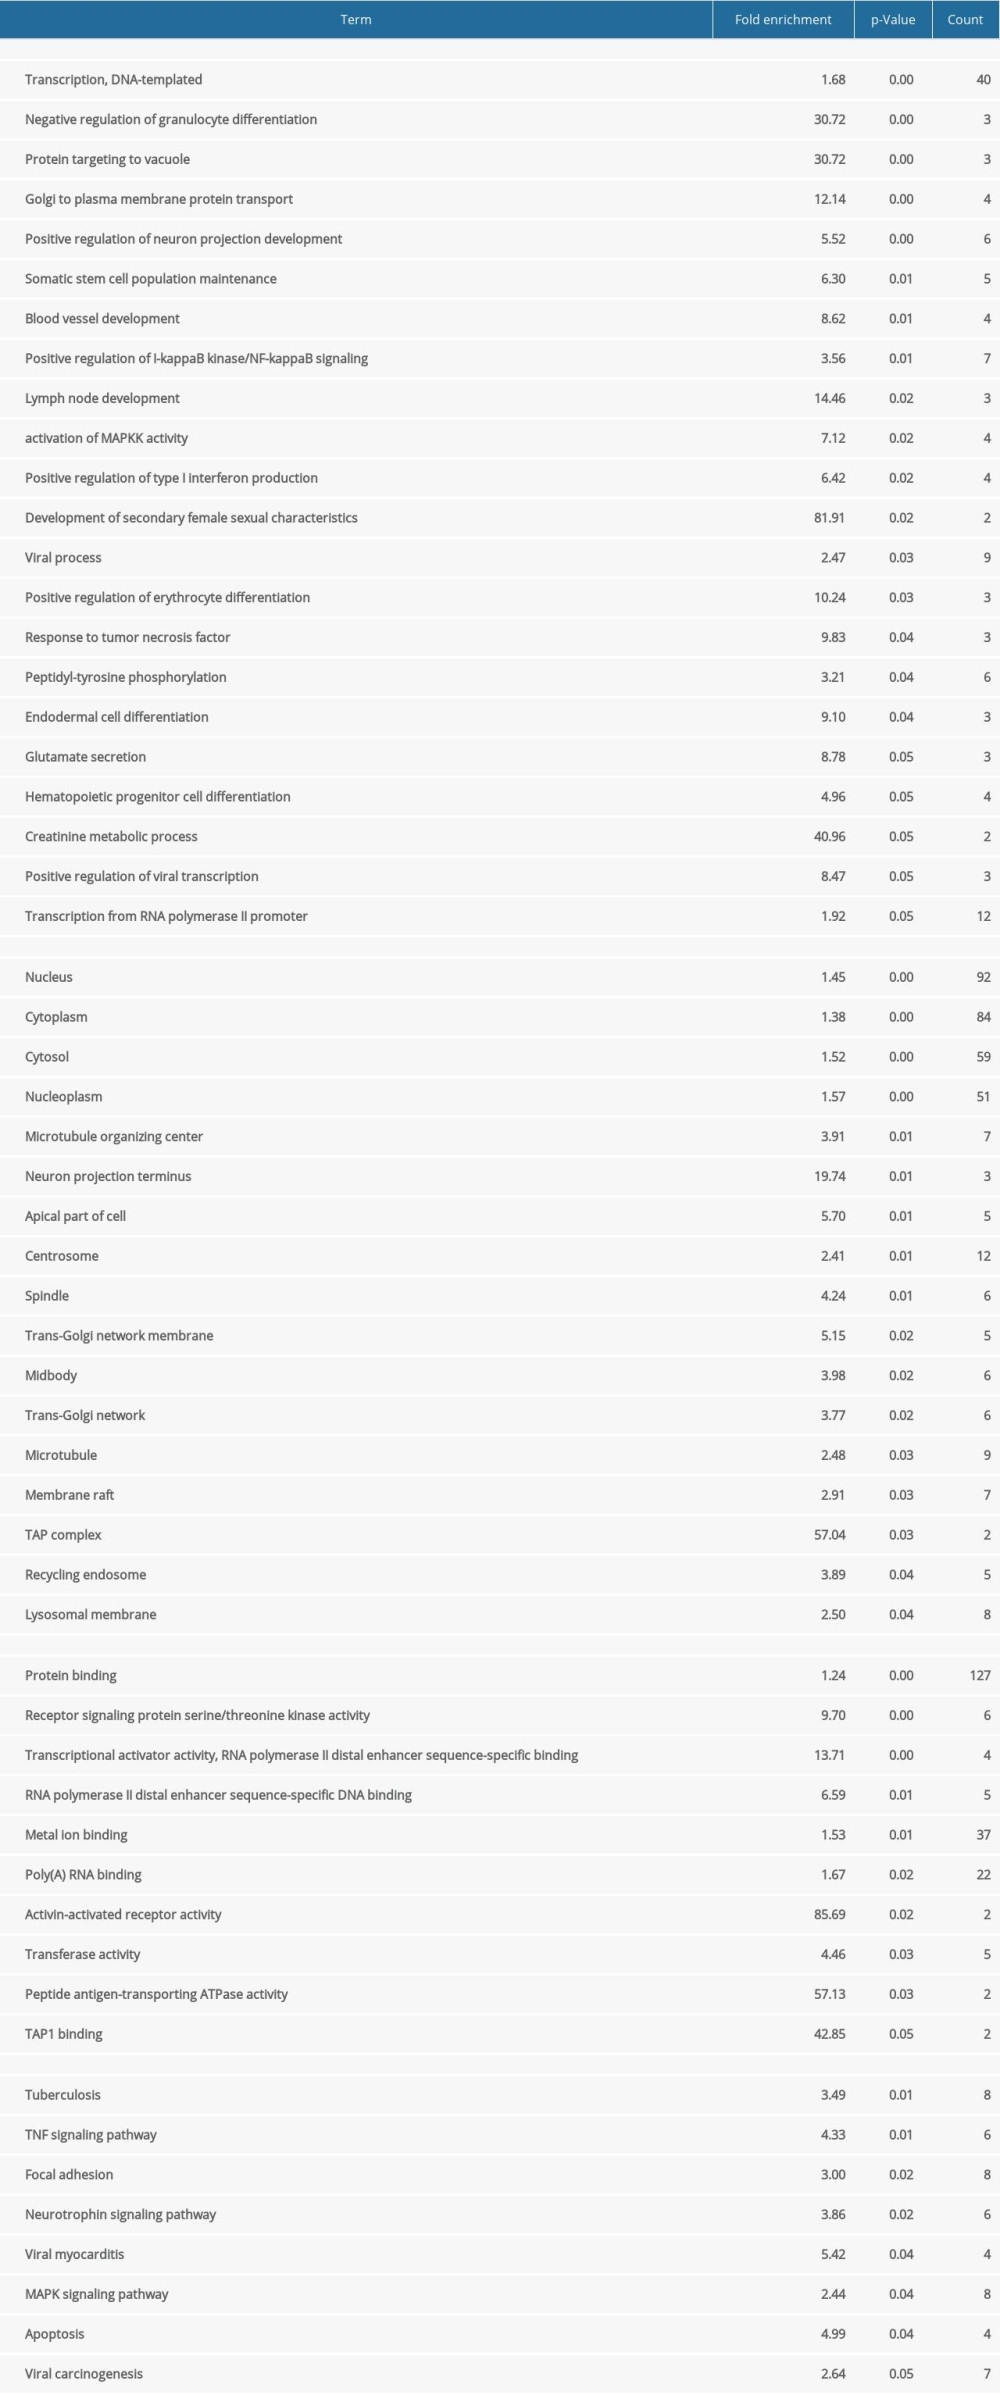
References
1. Meccariello G, Maniaci A, Bianchi G, Neck dissection and trans oral robotic surgery for oropharyngeal squamous cell carcinoma: Auris Nasus Larynx, 2022; 49(1); 117-25
2. Sopka DM, Li T, Lango MN, Dysplasia at the margin? Investigating the case for subsequent therapy in ‘low-risk’ squamous cell carcinoma of the oral tongue: Oral Oncol, 2013; 49(11); 1083-87
3. Shield KD, Ferlay J, Jemal A, The global incidence of lip, oral cavity, and pharyngeal cancers by subsite in 2012: Cancer J Clin, 2017; 67(1); 51-64
4. Panarese I, Aquino G, Ronchi A, Oral and oropharyngeal squamous cell carcinoma: Prognostic and predictive parameters in the etiopathogenetic route: Expert Rev Anticancer Ther, 2019; 19(2); 105-19
5. Vázquez-Mahía I, Seoane J, Varela-Centelles P, Predictors for tumor recurrence after primary definitive surgery for oral cancer: J Oral Maxillofac Surg, 2012; 70(7); 1724-32
6. Wang W, Han S, Yao Z, A study of epidemiologic and recurrence factors of oral cancer: J Oral Maxillofac Surg, 2012; 70(9); 2205-10
7. Wang B, Zhang S, Yue K, The recurrence and survival of oral squamous cell carcinoma: a report of 275 cases: Chin J Cancer, 2013; 32(11); 614-18
8. Joo YH, Cho JK, Koo BS, Guidelines for the surgical management of oral cancer: Korean Society of Thyroid-Head and Neck Surgery: Clin Exp Otorhinolaryngol, 2019; 12(2); 107-44
9. Lafuente Ibáñez de Mendoza I, Maritxalar Mendia X, García de la Fuente AM, Role of Porphyromonas gingivalis in oral squamous cell carcinoma development: A systematic review: J Periodontal Res, 2020; 55(1); 13-22
10. Moergel M, Kämmerer P, Kasaj A, Chronic periodontitis and its possible association with oral squamous cell carcinoma – a retrospective case control study: Head Face Med, 2013; 9; 39
11. Yao QW, Zhou DS, Peng HJ, Association of periodontal disease with oral cancer: A meta-analysis: Tumour Biol, 2014; 35(7); 7073-77
12. Moraes RC, Dias FL, Figueredo CM, Association between chronic periodontitis and oral/oropharyngeal cancer: Braz Dent J, 2016; 27(3); 261-66
13. Michaud DS, Fu Z, Shi J, Periodontal disease, tooth loss, and cancer risk: Epidemiol Rev, 2017; 39(1); 49-58
14. Aas JA, Paster BJ, Stokes LN, Defining the normal bacterial flora of the oral cavity: J Clin Microbiol, 2005; 43(11); 5721-32
15. Bellotti R, Speth C, Adolph TE, Micro- and mycobiota dysbiosis in pancreatic ductal adenocarcinoma development: Cancers (Basel), 2021; 13(14); 3431
16. Wang KK, He KY, Yang JY, Lactobacillus suppresses tumorigenesis of oropharyngeal cancer via enhancing anti-tumor immune response: Front Cell Dev Biol, 2022; 10; 842153
17. Gao JL, Kwan AH, Yammine A: Nat Commun, 2018; 9(1); 4097
18. Liu S, Zhou X, Peng X: J Immunol, 2020; 205(1); 282-89
19. Lanzós I, Herrera D, Santos S, Microbiological effects of an antiseptic mouthrinse in irradiated cancer patients: Med Oral Patol Oral Cir Bucal, 2011; 16(7); e1036-42
20. Singh S, Singh S, Tiwari MB, Microflora analysis in the postchemotherapy patients of oral cancer: Natl J Maxillofac Surg, 2019; 10(2); 141-45
21. Tuominen H, Rautava J, Oral microbiota and cancer development: Pathobiology, 2021; 88(2); 116-26
22. Olsen I, Yilmaz Ö: J Oral Microbiol, 2019; 11(1); 1563410
23. Chang C, Geng F, Shi X, The prevalence rate of periodontal pathogens and its association with oral squamous cell carcinoma: Appl Microbiol Biotechnol, 2019; 103(3); 1393-404
24. Hu X, Shen X, Tian J, The effects of periodontitis associated microbiota on the development of oral squamous cell carcinoma: Biochem Biophys Res Commun, 2021; 576; 80-85
25. Wang M, Zhao J, Zhang L, Role of tumor microenvironment in tumorigenesis: J Cancer, 2017; 8(5); 761-73
26. Mughees M, Sengupta A, Khowal S, Mechanism of tumour microenvironment in the progression and development of oral cancer: Mol Biol Rep, 2021; 48(2); 1773-86
27. Noy R, Pollard JW, Tumor-associated macrophages: From mechanisms to therapy: Immunity, 2014; 41(1); 49-61 [Erratum in: Immunity. 2014;41(5):866]
28. Wu K, Lin K, Li X, Redefining tumor-associated macrophage subpopulations and functions in the tumor microenvironment: Front Immunol, 2020; 11; 1731
29. Funes SC, Rios M, Escobar-Vera J, Implications of macrophage polarization in autoimmunity: Immunology, 2018; 154(2); 186-95
30. Pan Y, Yu Y, Wang X, Tumor-associated macrophages in tumor immunity: Front Immunol, 2020; 11; 583084 [Erratum in: Front Immunol. 2021;12:775758]
31. Guan Y, Li M, Qiu Z, Comprehensive analysis of DOK family genes expression, immune characteristics, and drug sensitivity in human tumors: J Adv Res, 2021; 36; 73-87
32. Mashima R, Hishida Y, Tezuka T, The roles of Dok family adapters in immunoreceptor signaling: Immunol Rev, 2009; 232(1); 273-85
33. Guittard G, Pontarotti P, Granjeaud S, Evolutionary and expression analyses reveal a pattern of ancient duplications and functional specializations in the diversification of the Downstream of Kinase (DOK) genes: Dev Comp Immunol, 2018; 84; 193-98
34. Lemay S, Davidson D, Latour S, Dok-3, a novel adapter molecule involved in the negative regulation of immunoreceptor signaling: Mol Cell Biol, 2000; 20(8); 2743-54
35. Liu X, Chen F, Li W, Elevated expression of DOK3 indicates high suppressive immune cell infiltration and unfavorable prognosis of gliomas: Int Immunopharmacol, 2020; 83; 106400
36. Loh JT, Teo JKH, Lim HH, Emerging roles of downstream of kinase 3 in cell signaling: Front Immunol, 2020; 11; 566192
37. Cai X, Xing J, Long CL, DOK3 modulates bone remodeling by negatively regulating osteoclastogenesis and positively regulating osteoblastogenesis: J Bone Miner Res, 2017; 32(11); 2207-18
38. Ritchie ME, Phipson B, Wu D, limma powers differential expression analyses for RNA-sequencing and microarray studies: Nucleic Acids Res, 2015; 43(7); e47
39. Cedoz PL, Prunello M, Brennan K, MethylMix 2.0: An R package for identifying DNA methylation genes: Bioinformatics, 2018; 34(17); 3044-46
40. Wu T, Hu E, Xu S, clusterProfiler 4.0: A universal enrichment tool for interpreting omics data: Innovation (Camb), 2021; 2(3); 100141
41. Ozhan A, Tombaz M, Konu O, SmulTCan: A Shiny application for multivariable survival analysis of TCGA data with gene sets: Comput Biol Med, 2021; 137; 104793
42. Blanche P, Dartigues JF, Jacqmin-Gadda H, Estimating and comparing time-dependent areas under receiver operating characteristic curves for censored event times with competing risks: Stat Med, 2013; 32(30); 5381-97
43. Langfelder P, Horvath S, WGCNA: An R package for weighted correlation network analysis: BMC Bioinformatics, 2008; 9; 559
44. Mayakonda A, Lin DC, Assenov Y, Maftools: Efficient and comprehensive analysis of somatic variants in cancer: Genome Res, 2018; 28(11); 1747-56
45. Sahingur SE, Yeudall WA, Chemokine function in periodontal disease and oral cavity cancer: Front Immunol, 2015; 6; 214
46. Hayes RB, Ahn J, Fan X, Association of oral microbiome with risk for incident head and neck squamous cell cancer: JAMA Oncol, 2018; 4(3); 358-65
47. Singh R, Mishra MK, Aggarwal H, Inflammation, immunity, and cancer: Mediators Inflamm, 2017; 2017; 6027305
48. Johnson DE, Burtness B, Leemans CR, Head and neck squamous cell carcinoma: Nat Rev Dis Primers, 2020; 6(1); 92
49. Shao W, Fujiwara N, Mouri Y: Sci Rep, 2021; 11(1); 14943
50. Chattopadhyay I, Verma M, Panda M, Role of oral microbiome signatures in diagnosis and prognosis of oral cancer: Technol Cancer Res Treat, 2019; 18; 1533033819867354
51. Wen L, Mu W, Lu H: J Dent Res, 2020; 99(6); 666-75
52. Liu D, Liu S, Liu J: Mol Oral Microbiol, 2021; 36(3); 182-91
53. Bugueno IM, Batool F, Keller L, Porphyromonas gingivalis bypasses epithelial barrier and modulates fibroblastic inflammatory response in an in vitro 3D spheroid model: Sci Rep, 2018; 8(1); 14914
54. Wang H, Zhou H, Duan X: Infect Immun, 2014; 82(10); 4118-26
55. Li Y, Mooney EC, Xia XJ, A20 Restricts inflammatory response and desensitizes gingival keratinocytes to apoptosis: Front Immunol, 2020; 11; 365
56. Konishi H, Urabe S, Teraoka Y: Placenta, 2020; 99; 21-26
57. Coussens LM, Werb Z, Inflammation and cancer: Nature, 2002; 420(6917); 860-67
58. Landskron G, De la Fuente M, Thuwajit P, Chronic inflammation and cytokines in the tumor microenvironment: J Immunol Res, 2014; 2014; 149185
59. Guo ZC, Jumatai S, Jing SL: Oncol Lett, 2021; 21(3); 189
60. Castro SA, Collighan R, Lambert PA: Cell Death Dis, 2017; 8(3); e2644
61. Vitale I, Manic G, Coussens LM, Macrophages and metabolism in the tumor microenvironment: Cell Metab, 2019; 30(1); 36-50
62. Núñez-Acurio D, Bravo D, Aguayo F, Epstein-Barr virus-oral bacterial link in the development of oral squamous cell carcinoma: Pathogens, 2020; 9(12); 1059
63. Palomero T, Couronné L, Khiabanian H, Recurrent mutations in epigenetic regulators, RHOA and FYN kinase in peripheral T cell lymphomas: Nat Genet, 2014; 46(2); 166-70
64. Sumiyoshi H, Matsushita A, Nakamura Y, Suppression of STAT5b in pancreatic cancer cells leads to attenuated gemcitabine chemoresistance, adhesion and invasion: Oncol Rep, 2016; 35(6); 3216-26
65. Zhou M, Liu X, Li Z, Caspase-3 regulates the migration, invasion and metastasis of colon cancer cells: Int J Cancer, 2018; 143(4); 921-30
66. Kang BW, Jeon HS, Chae YS, Impact of genetic variation in microRNA-binding site on susceptibility to colorectal cancer: Anticancer Res, 2016; 36(7); 3353-61
67. Gao WS, Qu YJ, Huai J, DOK3 is involved in microglial cell activation in neuropathic pain by interacting with GPR84: Aging (Albany NY), 2020; 13(1); 389-410
68. Vidyarthi A, Agnihotri T, Khan N, Predominance of M2 macrophages in gliomas leads to the suppression of local and systemic immunity: Cancer Immunol Immunother, 2019; 68(12); 1995-2004
Figures
Figure 1. Distributions of differentially-expressed genes.(A, B) The volcano plot of GSE24897 and GSE85793. Green dots represent significantly downregulated genes, red dots represent significantly upregulated genes, and black dots represent insignificantly changed genes. (C, D) The heatmaps of DEGs. Blue color represents low expression genes, red color represents high expression genes, and different color brightness represents gene expression. R software 4.1.3 version was used for visualization.Figure 2. Venn plots of differentially-expressed genes (DEGs).Venn plots of DEGs showing upregulated (A) and downregulated genes (B). R software 4.1.3 version was used for visualization.Figure 3. The GO and KEGG analysis.The significant enrichment terms in (A) BP, (B) CC, and (C) MF were shown using a scatter plot. The significant pathways involved in (D) KEGG enrichment was shown using a scatter plot. Colors represent the P values and sizes of the spots represent the counts of genes. R software 4.1.3 version was used for visualization.Figure 4. The PPI network.A network of protein–protein interactions (PPI) was built using STRING. Different nodes represent different proteins and the edges represent the degree of connection between proteins. String version 11.5 was used for visualization.Figure 5. Hub genes computed by MCC algorithm.The top 10 hub genes were obtained by the MCC algorithm. Cytoscape version 3.9.0 was used for visualization.Figure 6. The relationship between DOK3 expression and macrophage infiltration. (A) The DOK3 expression in P. gingivalis infection of macrophages microarray; (B) macrophages infiltration affected by DOK3. GraphPad Prism 8 was used for visualization in Figure 5A, and the TIMER 2.0 online tool was used for visualization in Figure 5B.Figure 7. The expression of DOK3 in recurrent OSCC patients with differentP. gingivalis infections (B and D, 200×) compared with non-immune IgG staining as a control (A and C, 200×).The yellow-stained granules represent DOK3 staining-positive cells, and the larger yellow staining area represents higher DOK3 expression. In Press
05 Mar 2024 : Clinical Research
Muscular Function Recovery from General Anesthesia in 132 Patients Undergoing Surgery with Acceleromyograph...Med Sci Monit In Press; DOI: 10.12659/MSM.942780
05 Mar 2024 : Clinical Research
Effects of Thermal Insulation on Recovery and Comfort of Patients Undergoing Holmium Laser LithotripsyMed Sci Monit In Press; DOI: 10.12659/MSM.942836
05 Mar 2024 : Clinical Research
Role of Critical Shoulder Angle in Degenerative Type Rotator Cuff Tears: A Turkish Cohort StudyMed Sci Monit In Press; DOI: 10.12659/MSM.943703
06 Mar 2024 : Clinical Research
Comparison of Outcomes between Single-Level and Double-Level Corpectomy in Thoracolumbar Reconstruction: A ...Med Sci Monit In Press; DOI: 10.12659/MSM.943797
Most Viewed Current Articles
17 Jan 2024 : Review article
Vaccination Guidelines for Pregnant Women: Addressing COVID-19 and the Omicron VariantDOI :10.12659/MSM.942799
Med Sci Monit 2024; 30:e942799
14 Dec 2022 : Clinical Research
Prevalence and Variability of Allergen-Specific Immunoglobulin E in Patients with Elevated Tryptase LevelsDOI :10.12659/MSM.937990
Med Sci Monit 2022; 28:e937990
16 May 2023 : Clinical Research
Electrophysiological Testing for an Auditory Processing Disorder and Reading Performance in 54 School Stude...DOI :10.12659/MSM.940387
Med Sci Monit 2023; 29:e940387
01 Jan 2022 : Editorial
Editorial: Current Status of Oral Antiviral Drug Treatments for SARS-CoV-2 Infection in Non-Hospitalized Pa...DOI :10.12659/MSM.935952
Med Sci Monit 2022; 28:e935952