13 December 2021: Database Analysis
Integrated Analysis of Angiogenesis-Mediated Tumor Immune Microenvironment Pattern in Hepatocellular Carcinoma (HCC) and a Novel Prognostic Model Construction to Predict Patient Outcome
Chengqian Lv1BCEF, Qianqian Huang1CF, Xu Zhang1CF, Huimin Cai1CF, Xuechun Ji1CF, Jing Shao1CF, Bingrong LiuDOI: 10.12659/MSM.934937
Med Sci Monit 2021; 27:e934937


Abstract
BACKGROUND: Hepatocellular carcinoma (HCC) is a malignant tumor which is famous for its high heterogeneity and complex pathogenesis. Angiogenesis is an important driver of tumor progression and immune-suppressive microenvironment formation.
MATERIAL AND METHODS: A training set was acquired from the TCGA-LIHC cohort. An angiogenesis-active subtype was identified by consensus clustering analysis. The tumor subtype’s immune microenvironment pattern was analyzed using quanTIseq. DEGs-mediated biology function was analyzed by enrichment analysis based on GO and KEGG. A prognostic model was constructed using LASSO Cox regression analysis and validated by 2 external datasets derived from GEO and ICGC. Quantitative real-time PCR assay was conducted to analyze CDCA8’s expression status in the HCC line and normal liver cell line.
RESULTS: In HCC, patients with the angiogenesis-active subtype had a poor prognosis. Angiogenesis can shape the tumor microenvironment into high-M2 microphage infiltration and activity pattern. Here, we identified an angiogenesis-active HCC subtype and constructed an angiogenesis feature-based prognostic model to predict patient outcome. The external validation sets were enrolled to verify the accuracy of this model.
CONCLUSIONS: Our research demonstrated angiogenesis can confer the tumor immune-suppressive characteristic. We provide a robust method to evaluate the HCC’s angiogenesis potential and help identify the angiogenesis-active subtype. Validation in the external validation cohort further confirmed the accuracy of our prognostic model.
Keywords: Carcinoma, Hepatocellular, Immunity, Humans, Liver Neoplasms, Neovascularization, Pathologic, Patient Outcome Assessment, tumor microenvironment
Background
As one of the most important public health concerns around the world, HCC has become the sixth most common neoplasm and the fourth primary cause of cancer-related death all over the world [1]. Because of its biology characteristics heterogeneity, complex pathogenesis, and aggressive biology features, HCC is infamous for its poor therapy responsiveness, low early detection rate, and poor patient outcomes [2]. In recent years, comprehensive treatment combined with immunotherapy, radiotherapy, chemotherapy and surgery is widely applied clinically. However, because of its low rate of early detection and high disease recurrence rate, few patients have the chance to receive comprehensive and effective treatment [3,4]. Thus, there is an urgent need for thorough research on the mechanism underlying HCC tumorigenesis and progression and related poor prognosis of certain tumor subtypes to facilitate precise treatment.
Because of the expanding tumor mass during HCC cell proliferation, its elevated high oxygen and metabolic substrate requirement have become important tumor characteristics [5–7]. Angiogenesis is the core biological feature of HCC formation. Angiogenesis begins with an imbalance between pro-angiogenic and anti-angiogenic factors [8]. Vascular endothelial growth factor (VEGFA) is the critical promoter of the tumor’s endothelial proliferation, migration, and neovascularization to support its rapid tumorigenesis and local metastasis by activating the PI3K/AKT signaling pathway [9,10]. Angiogenesis plays a crucial role in HCC progression, and drugs targeting angiogenesis, such as sorafenib and lenvatinib, are important components of first-line treatment and systemic treatment of HCC [11,12]. Predictive biomarkers such as pERK and imaging criteria have been proposed for identification of tumors with the active angiogenesis subtype, but none of them have been approved for clinical use [13,14], and this gap has been one of the obstacles to precise treatment of patients with the active angiogenesis HCC subtype. To solve this problem, we developed a machine-learning-based prognostic model to help evaluate a tumor’s angiogenesis activity and to predict patient outcome.
The present study analyzed the angiogenesis-mediated biological features and tumor microenvironment immune cell infiltration alterations to reveal its underlying pro-tumor mechanism. To promote angiogenesis HCC subtype identification and related individualized treatment in clinic practice, we constructed an angiogenesis-based prognostic model based on the clinical information and transcription data acquired from The Cancer Genome Atlas (TCGA) and assessed the model’s accuracy based on the dataset acquired from GSE14520 and ICGC-JP. According to our results, our prognostic model has satisfactory accuracy in predicting HCC patient outcomes and shows potential to be implemented for HCC diagnosis and precision treatment.
Material and Method
DATA ACQUISITION AND PROCESSING:
Transcription data and clinical information of the training set were obtained from The Cancer Genome Atlas LIHC project (TCGA-LIHC). The samples that had transcription data and follow-up information were included in analysis. The TCGA data were obtained using the R package “TCGAbiolinks” [15]. The RNA-seq data were normalized with transcripts per million (TPM) method and then transformed to log2 (TPM+1). The validation set’s clinical and transcription data were acquired from ICGC-JP (https://dcc.icgc.org) and GSE14520 [16], separately. To make the gene expression profiling suitable for comparison, the RNA-seq data of ICGC-JP were also normalized by log2 (TPM+1) format, and the microarray’s probe value of GSE14520 was also log2(X+1) transformed.
The angiogenesis-related genes markers were downloaded from the gene set “Angiogenesis” from MSigDB [17].
IDENTIFICATION OF THE SUBTYPE WITH DIFFERENT ANGIOGENESIS STATUS:
To identify the HCC subtype with different angiogenesis status, we conducted consensus clustering analysis using the R package “ConsensusClusterPlus” [18]. Consensus clustering analysis was based on the angiogenesis-related genes, with 80% of the total sample drawn 100 times.
TUMOR IMMUNE INFILTRATION ANALYSIS:
To estimate the proportion of the immune-infiltrating cells in the tumor microenvironment, we used the R package “quanTIseq” to analyze the tumor subtype’s immune status [19].
DEG’S ACQUISITION AND ENRICHMENT ANALYSIS:
To acquire the DEGs between the active angiogenesis subtype and inactive angiogenesis subtype for further function analysis, we used the R package “Limma” to obtain DEGs. DEGs were identified under the threshold of log2 (Foldchange) >2 and P<0.05. To analyze the DEGs-mediated biology function, we conducted enrichment analysis using the R package “ClusterProfiler” [20]. Function enrichment analysis was based on the Gene Ontology (GO) [21] dataset, which includes molecular function (MF), biological pathways (BP), and cellular components (CC) and the Kyoto Encyclopedia of Genes and Genomes (KEGG) [22] dataset.
CONSTRUCTION AND VALIDATION OF THE PROGNOSTIC MODEL:
To select the genes among DEGs for prognostic model construction, we used univariate Cox regression to analyze the genes’ impact on patient OS. Genes with P value <0.01 were selected and submitted for the subsequent LASSO Cox regression. Then, the R package “glmnet” was used to conduct LASSO Cox regression to determine the features and assess their contribution as an independent prognostic factor for patient OS [23]. In this way, the novel 13-genes prognostic model based on the angiogenesis features was developed according to the feature’s regression coefficients (β), which were obtained from the LASSO Cox regression model multiplied by its related mRNA expression. Then, we computed the risk score of each sample in the training set according to our prognostic model and divided them into a high-risk group and a low-risk group based on the median cut-off. Patient outcome was compared by log-rank test and the receiver operating characteristic (ROC) curve was plotted using the R package “survivalROC” [24]. The risk score of samples of the validation set were also assessed and the samples were also divided into a high-risk group and low-risk group and further compared in the same way.
CELL CULTURE AND QUANTITATIVE REAL-TIME PCR:
Human HCC cell line (HepG2) and normal liver cell line (LO2) were cultured in RPMI-1640 medium (Hyclone, Beijing, China) with 10% FBS (Hyclone, Beijing, China) and 1% streptomycin-penicillin (Hyclone, Beijing, China). The cells were maintained in a humidified chamber containing 5% CO2 at 37°C.
Total RNA of the HCC cells was extracted using TRIzol (Invitrogen, Beijing, China). First-strand cDNA was synthesized using EasyScript First-Strand cDNA Synthesis SuperMix (TransGen, Beijing, China). Quantitative real-time PCR was conducted using SYBR Green qPCR SuperMix (Vazyme, Nanjing, China) in the ABI PRISM® 7500 Sequence Detection System (Applied Biosystems, Shanghai, China). Relative mRNA levels were calculated using the −ΔΔCt method using 18S rRNA as control and presented as 2(−ΔΔCt). The primers were:
STATISTICAL ANALYSIS:
During the comparison of 2 groups, we used the Wilcox test. In the comparison among multi-groups, we used the Kruskal-Wallis test. Analysis of correlations between 2 continuous variables was conducted by Spearman correlation. For the quantitative real-time PCR assay, data are presented as mean±standard deviation (SD) and the comparison between 2 groups was conducted by
Results
IDENTIFICATION OF ACTIVE ANGIOGENESIS SUBTYPE:
First, we used consensus clustering analysis to identify the active angiogenesis subtype based on the angiogenesis markers derived from MSigDB. A graphical representation of consensus clustering results is shown in a CDF curve and delta area plot (Figure 1A, 1B). According to the results, the subgroups were divided under the K value=4. To validate the robustness of the subtype identification, we test the angiogenesis marker-VEGFA’s expression in the four subtypes (Figure 1C). G4 performs the significant higher expression level of VEGFA while G1 has the significant lower expression level of VEGFA. Thus, G4 was identified as angiogenesis active subtype and G1 was identified as angiogenesis inactive subtype. Meanwhile, Kaplan-Meier plot was plotted and the result demonstrated that angiogenesis active group patients have shorter survival time comparing with the patients in angiogenesis inactive subtype. (P=0.0561; Figure 1D), which indicate that active angiogenesis can be the biology characteristics of aggressive HCC
IMMUNE INFILTRATION ANALYSIS OF ACTIVE ANGIOGENESIS SUBTYPE AND ANGIOGENESIS INACTIVE SUBTYPE:
To further analyze the immune microenvironment pattern differences between the active angiogenesis subtype and inactive angiogenesis subtype, we applied quanTIseq to estimate the infiltration level of immune cells. Results indicated that the active angiogenesis subtype has a significantly higher M2 microphage infiltration level than the inactive angiogenesis subtype (Figure 2A). To assess the M2 microphage’s activity and immune-suppressive function, M2 microphage-related genes IL4, IL13, CSF1, IL10, GFB1, and TGFB2 were enrolled in the analysis (Figure 2B) [25]. A higher M2 microphage-related genes expression level suggests that the active angiogenesis subtype’s infiltrating M2 microphage has active immune-suppressive activity.
IDENTIFICATION OF DEGS AND RELATED FUNCTION ANALYSIS:
To analyze the angiogenesis-mediated biology heterogeneity between the 2 subtypes, we acquired DEGs between the 2 subtypes. Among the 1179 DEGs, 953 are upregulated genes and 226 are downregulated genes. The result was visualized by volcano plot and heat map (Figure 3A, 3B).
To further research the biology function that these genes mediate, enrichment analysis was performed. According to Figure 3C, the PI3K-Akt signaling pathway and human papillomavirus infection are the significantly enriched terms in the KEGG pathway (up). Among the KEGG pathway (down), complement and coagulation cascades is the most enriched term. In the GO pathway (up), extracellular matrix organization is the most enriched term. In the GO pathway (down), small-molecule catabolic process is remarkably enriched (Figure 3C–3F).
CONSTRUCTION OF THE ANGIOGENESIS-BASED GENE PROGNOSTIC MODEL:
To support clinical application, we constructed a gene prognostic model to predict HCC patient outcome. Univariate Cox analysis was used to determine the genes that are suitable for LASSO regression among the DEGs. Genes with P<0.001 were considered to have significant impact on patient outcome and were submitted to subsequent LASSO Cox regression analysis. According to the LASSO Cox regression analysis results, 13 genes would be optimized to construct the gene prognostic model (Figure 4A, 4B). The risk score formula reads as follows:
To validate the efficiency of the prognostic model, we divided patients into high- and low-risk groups according to the median cut-off (Figure 4C). The Kaplan-Meier survival curve demonstrated that compared with the low-risk group, the high-risk group had a significantly worse outcome (P=2.03e-07, Figure 4C–4F). ROC curves indicated that the model has the best prediction ability for 1-year patient outcome (Figure 4G).
GENE PROGNOSTIC MODEL VALIDATION:
The external sets GSE14520 and ICGC-JP were employed to examine the prediction accuracy of the gene prognostic model. Kaplan-Meier analysis indicated that the high-risk group had significantly worse prognosis than the low-risk group (Figure 5A, 5C). ROC curves showed that AUC rate for 1-year, 3-year, and 5-year OS were 0.561, 0.626, and 0.671, respectively in GSE14520 and the AUC rates for 1-year and 3-year OS were 0.763 and 0.747, respectively, in ICGC-JP (Figure 5B, 5D). Since there were only 2 sample with OS more than 5 years, the 5-year survival is not included in ROC curve in ICGC-JP. These results proved the accuracy of our prognostic model. To further validate our prognostic model’s potential in predicting HCC’s microenvironment pattern, we analyzed the correlation between the risk score (including prognostic model component genes) and immune infiltration level and immune-related gene expression (Figure 6). Risk score and prognostic model component genes with coefficient>0 were positively correlated with M2 macrophage infiltration level and M2 macrophage-related genes expression level, while prognostic model component genes with coefficient <0 were negatively correlated. Our results show that the prognostic model accurately reflects HCC M2 macrophage infiltration and activity.
CDCA8 HAD HIGHER EXPRESSION LEVEL IN HCC CELL LINE:
Among all prognostic model component genes, CDCA8 had the highest absolute value of coefficient (Figure 7A). Thus, we further examined the expression levels of CDCA8 in normal liver cell line (LO2) and HCC cell line (HepG2), and the quantitative real-time PCR assay showed that the expression level of CDCA8 in the HCC cell line was significantly higher than in the normal liver cell line (Figure 7B).
Disscussion
As a malignant tumor with rising incidence and mortality rate in recent years, tumor heterogeneity has become one of the important obstacles for precise treatment of HCC [26]. Angiogenesis is the essential process during formation of the HCC aggressive subtype and is an important feature of the poor prognosis subtype. Thus, analyzing the tumor biology features and immune microenvironment alterations that angiogenesis confers would be essential for targeting therapy according to HCC angiogenesis subtypes. To facilitate clinical application, a robust method is needed to identify the angiogenesis HCC subtype for individualized therapy for HCC patients.
Here, we first identified the angiogenesis subtype among the TCGA-LIHC cohort. Survival analysis proved the significant impact of angiogenesis during formation of the poor prognosis HCC subtype. Angiogenesis status is an important predictor of poor outcomes for HCC patients.
The immune microenvironment plays an important role during tumor proliferation and progression [27]. Recent research demonstrated that angiogenesis can significantly influence the tumor immune microenvironment pattern and exert important effects on the anti-tumor response of immune cells [28,29]. Therefore, we assessed the immune cell infiltration level of the HCC tumor microenvironment. Our results show that in the active angiogenesis tumor subtype, M2 macrophages are associated with elevated infiltration level. M2 macrophages are immune-suppressive cell that exert a pro-tumor function by mediating CD8+T cell dysfunction in the anti-tumor response of cytotoxic killing [25]. Its pro-tumor function and division rely on the cytokines IL4, IL13, CSF1, IL10, TGFB1, and TGFB2. Thus, we analyzed the expression of IL4, IL13, CSF1, IL10, TGFB1, and TGFB2. The high M2 macrophage-related gene expression in the active angiogenesis subgroup indicates the high activity of M2 macrophage in this HCC subtype. In current clinic application, therapy combining angiogenesis inhibitor and immunotherapy has a satisfactory responsive rate [30]. Our research suggests the potential of this combined treatment strategy for use in individualized treatment for HCC patients with the active angiogenesis subtype.
To further analyze the angiogenesis-mediated biology features alterations, we used enrichment analysis to determine the DEGs between the 2 subgroups of mediated biology function. The upregulated genes are involved in the PI3K pathway, extracellular structure organization, and extracellular matrix organization. The PI3K pathway is the essential cell signal pathway for cancer cell proliferation [31]. Ying Zhou also demonstrated that PI3K/Akt pathway activation is the essential part of angiogenesis in hepatocellular carcinoma [32]. Extracellular structure organization and extracellular matrix organization are important processes during tumor expansion [33,34]. Extracellular matrix organization and scaffolding can influence the rate of angiogenesis and capillary integrity and are required for blood vessel morphogenesis [35]. The results further proved the accuracy of our subtype identification and indicate that angiogenesis may be an important factor causing the frequent progression of HCC. Downregulated genes are involved in the inherent metabolic function of a normal liver. This result indicates that the active angiogenesis tumor subtype is associated with more significant low differentiation characteristics compared to the inactive angiogenesis tumor subtype.
We also constructed a prognostic model based on angiogenesis-related genes to assist clinicians to estimate a tumor’s angiogenesis potential and predict patient outcome. In the external validation sets GSE14520 and ICGC-JP, the prognostic model was accurate. In analysis of the prognostic model’s efficiency in predicting HCC’s microenvironment pattern, the prognostic model also performed well. These results prove our prognostic model’s robustness. In the quantitative real-time PCR assay, the HCC cell line had the highest expression level of CDCA8. The process of this research is presented as a workflow diagram in Figure 8. Our prognostic model construction genes’ regulating role in HCC was also reported in previous research. As a worse prognostic marker, TG6PD is essential for tumor proliferation and angiogenesis and is correlated with HCC invasion [36,37]. It has also been reported that high MMP1 expression is important in progression of HCC angiogenesis and is a tumor invasion driver [38,39]. Psallidas et al revealed that SPP1 promotes HCC metastasis and tumor angiogenesis [40,41]. A previous study indicated that HILPDA is a marker of poor prognosis. The expression level of HILPDA was significantly correlated with TAM infiltration level in most neoplasms and was associated with tumor immunosuppression status [42].
Conclusions
To sum up, we identified the angiogenesis subtype among the liver cancer and analyzed its impact on tumor biology features, immune microenvironment pattern, and patient outcome. Finally, we developed a reliable novel gene prognostic model to predict patient outcome and tumor angiogenesis potential. Therapy targeting specific HCC characteristic has significantly improved patient survival time [43]. An efficient method which can help identify tumor subtype with specific characteristic would be meaningful for individualized precision treatment. This prognostic model can potentiality assist clinicians in decision-making.
Figures
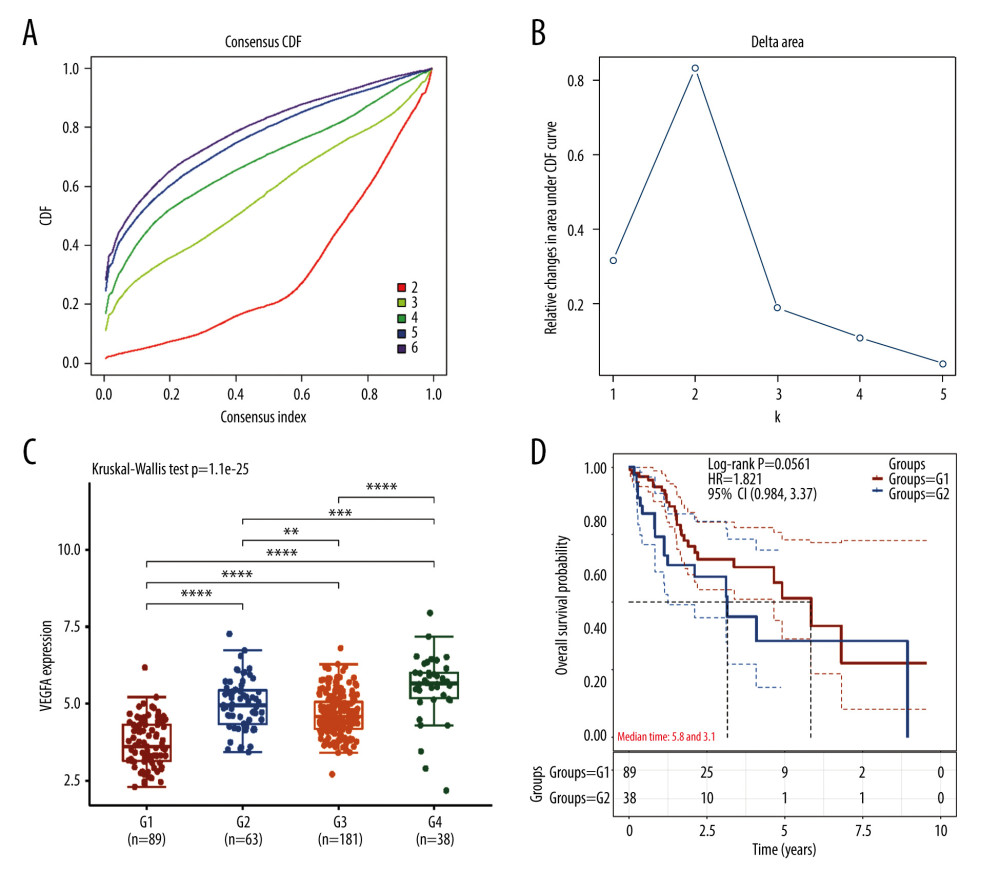 Figure 1. Identification of active angiogenesis subtype and inactive angiogenesis subtype. (A) Cumulative distribution function (CDF) curve with K value 2 to 6. (B) CDF Delta area curve for K=2 to 6. (C) VEGF expression of G1, G2, G3, G4. (D) Kaplan-Meier survival curves for G1 and G4. (R software Version 4.0.3, http://www.r-project.org).
 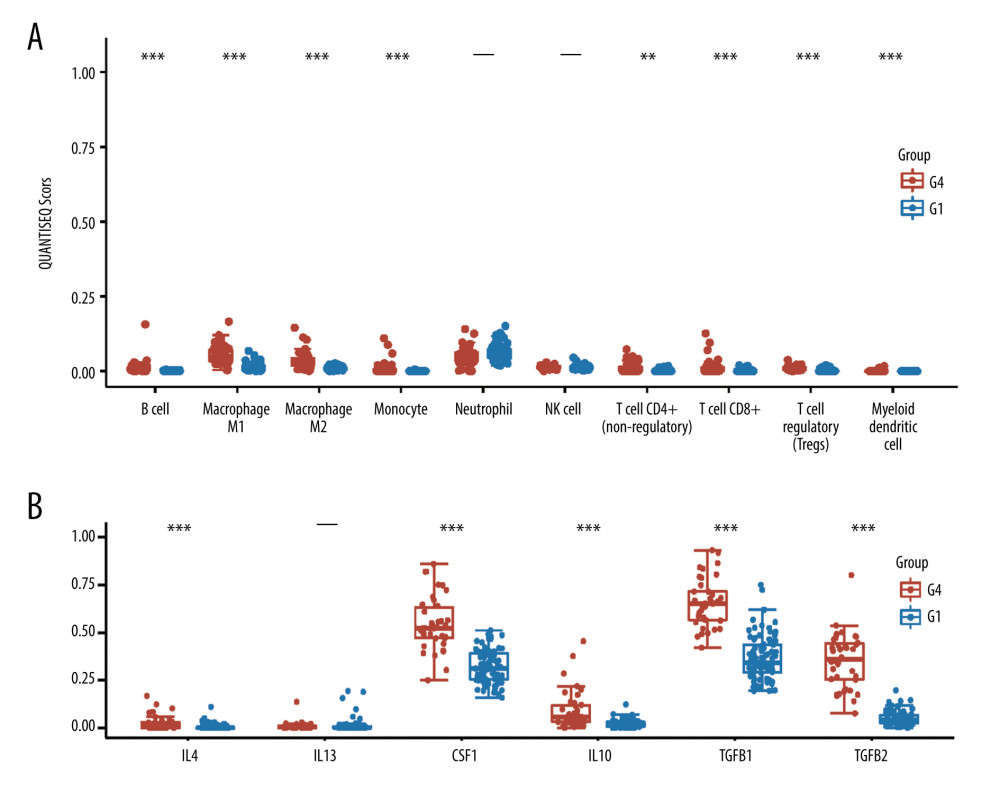 Figure 2. Immune status in active and inactive angiogenesis subtypes. (A) Immune infiltration status in active angiogenesis and inactive subtypes. (B) M2 microphage related genes expression status in active and inactive angiogenesis subtypes.* P<0.05; ** P<0.01; *** P<0.001. (R software Version 4.0.3, http://www.r-project.org).
 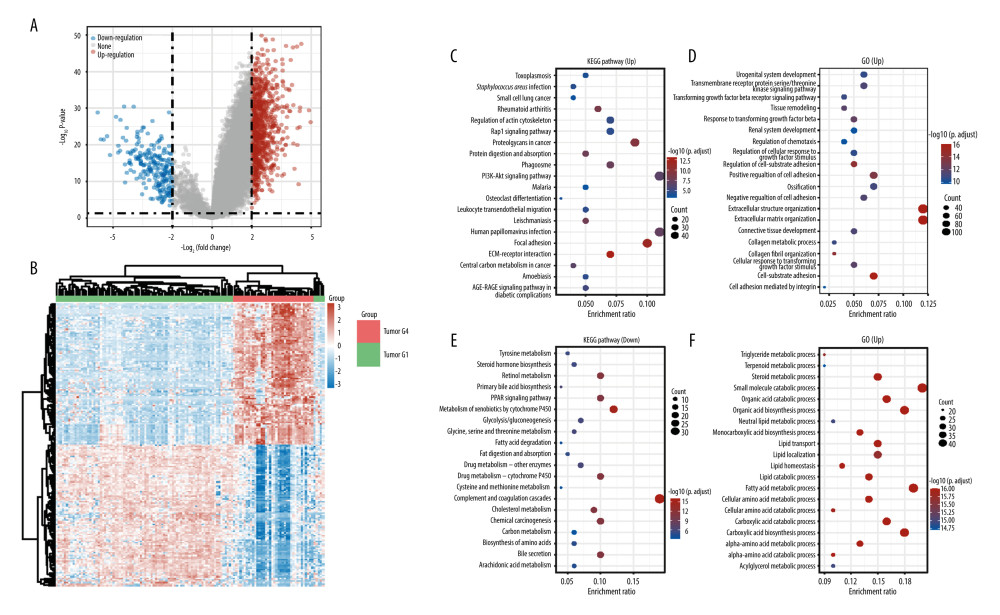 Figure 3. Acquisition of DEGs between active angiogenesis subtype and inactive subtype and related functional enrichment analysis. (A) Volcano plots of DEGS between active angiogenesis subtype and inactive subtype. (B) Heatmap of DEGS between active angiogenesis subtype and inactive subtype. (C) KEGG enrichment of upregulated genes in active angiogenesis subtype. (D) GO enrichment of upregulated genes in active angiogenesis subtype. (E) KEGG enrichment of downregulated genes in active angiogenesis subtype. (F) GO enrichment of downregulated genes in active angiogenesis subtype. (R software Version 4.0.3, http://www.r-project.org).
 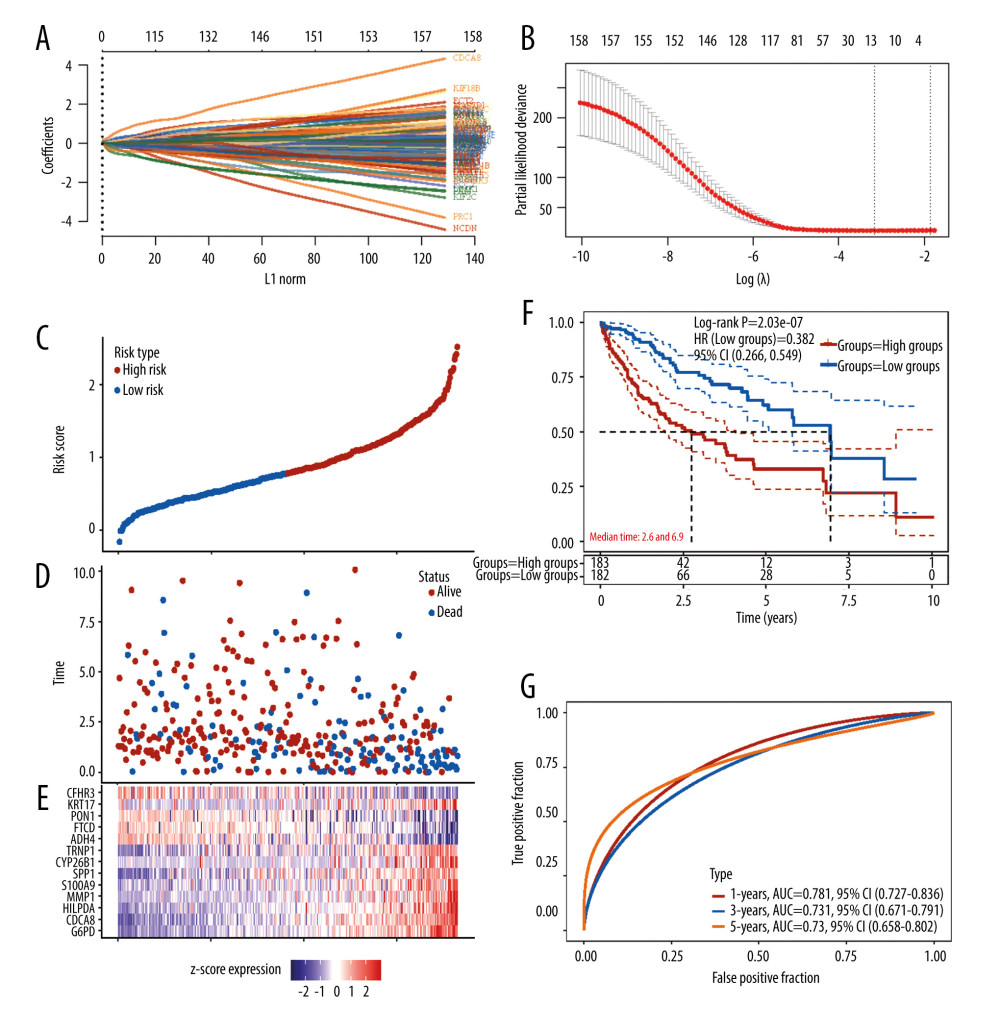 Figure 4. Construction of the angiogenesis-based gene risk model. (A) LASSO coefficient. (B) The partial likelihood deviance plot. (C) Risk score distribution. (D) Overall survival time of HCC patients. (E) Heatmap of 13 prognostic-related genes. (F) Kaplan-Meier survival analysis in the high- and low-risk groups. (G) ROC curve for the 1-, 3-, 5-year survival rates of HCC patients. (R software Version 4.0.3, http://www.r-project.org).
 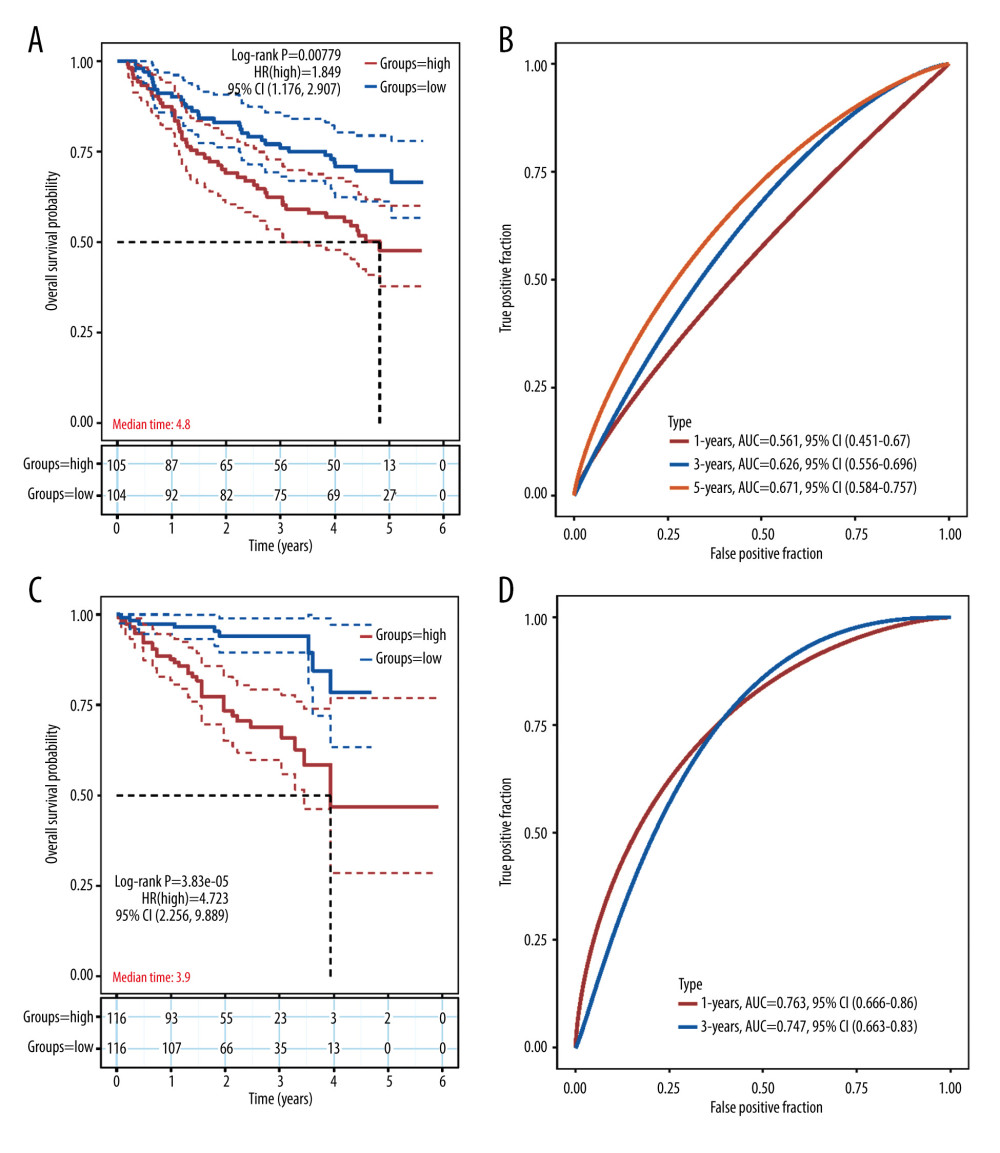 Figure 5. Validation of the prognostic model in the external validation set GSE14520 and ICGC-JP. (A) Kaplan-Meier plots in high- and low-risk groups in GSE14520. (B) ROC curves for 1-, 3-, 5-year OS prediction in GSE14520. (C) Kaplan-Meier plots in high- and low-risk groups in ICGC-JP. (D) ROC curves for 1-,3-,5-year OS prediction in ICGC-JP. (R software Version 4.0.3, http://www.r-project.org).
 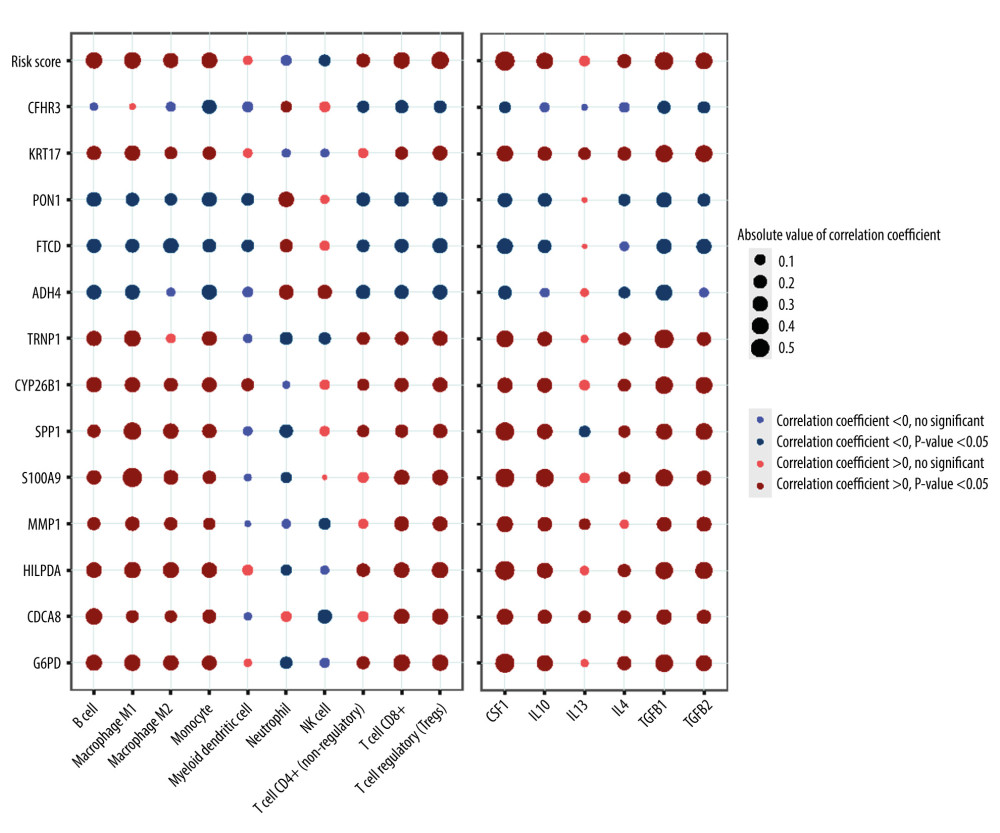 Figure 6. Correlation between the risk score (including prognostic model component genes) and immune features. (R software Version 4.0.3, http://www.r-project.org).
 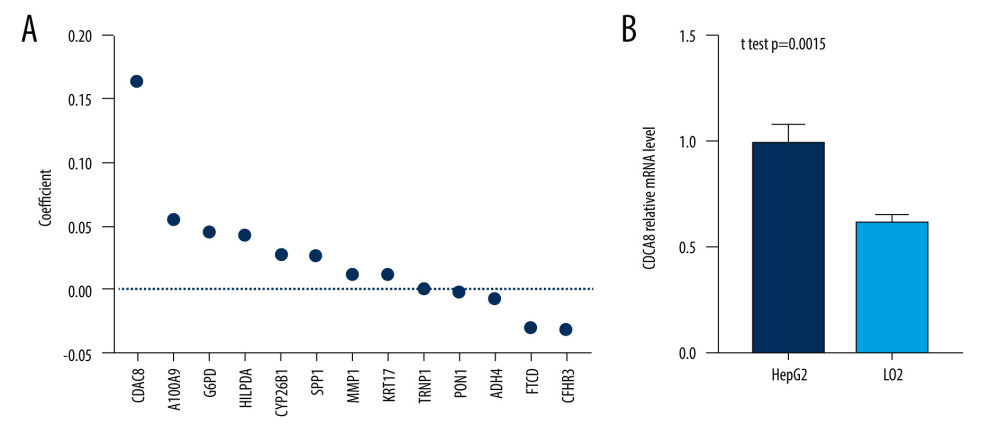 Figure 7. CDCA8 has the higher expression level in HCC cell line. (A) CDCA8 has the highest absolute value of coefficient in all prognostic model component genes. (B) CDCA8 expression was examined by quantitative real-time PCR assay in HCC cell line and normal liver cell line. (GraphPad Prism 8 Version 8.3.0, GraphPad).
 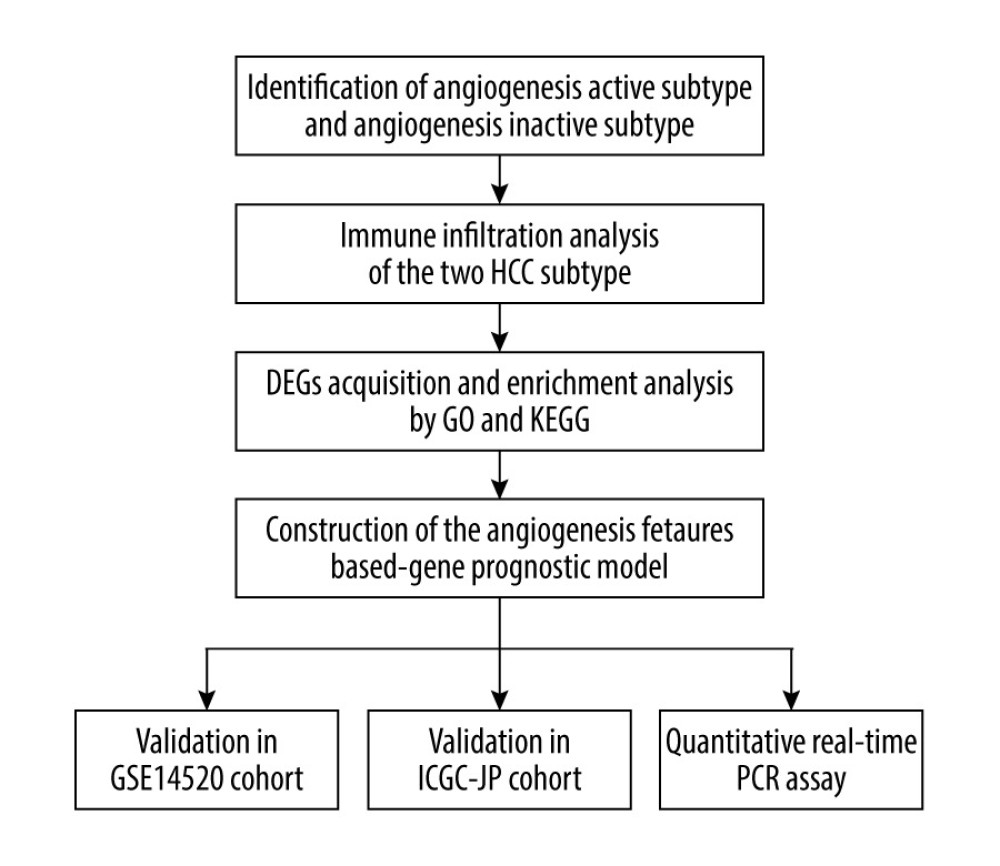 Figure 8. Flow chart of the study. (Adobe Illustrator Version 2020, Adobe).
 References
1. Bray F, Ferlay J, Soerjomataram I, Siegel RL, Global cancer statistics 2018: GLOBOCAN estimates of incidence and mortality worldwide for 36 cancers in 185 countries: Cancer J Clin, 2018; 68; 394-424
2. Yang JD, Hainaut P, Gores GJ, A global view of hepatocellular carcinoma: Trends, risk, prevention and management: Nat Rev Gastroenterol Hepatol, 2019; 16; 589-604
3. Llovet JM, Zucman-Rossi J, Pikarsky E, Hepatocellular carcinoma: Nat Rev Dis Primers, 2016; 2; 16018
4. Li X, Wang Y, Ye X, Liang P, Locoregional combined with systemic therapies for advanced hepatocellular carcinoma: An inevitable trend of rapid development: Front Mol Biosci, 2021; 8; 635243
5. Hanahan D, Weinberg RA, Hallmarks of cancer: The next generation: Cell, 2011; 144; 646-74
6. Berger M, Bergers G, Arnold B, Regulator of G-protein signaling-5 induction in pericytes coincides with active vessel remodeling during neovascularization: Blood, 2005; 105; 1094-101
7. Morikawa S, Baluk P, Kaidoh T, Abnormalities in pericytes on blood vessels and endothelial sprouts in tumors: Am J Pathol, 2002; 160; 985-1000
8. Morse MA, Sun W, Kim R, The role of angiogenesis in hepatocellular carcinoma: Clin Cancer Res, 2019; 25; 912-20
9. Folkman J, What is the evidence that tumors are angiogenesis dependent: J Natl Cancer Inst, 1990; 82; 4-6
10. Amini A, Masoumi Moghaddam S, Morris DL, Pourgholami MH, The critical role of vascular endothelial growth factor in tumor angiogenesis: Curr Cancer Drug Targets, 2012; 12; 23-43
11. Llovet JM, Ricci S, Mazzaferro V, Sorafenib in advanced hepatocellular carcinoma: N Engl J Med, 2008; 359(4); 378-90
12. Kudo M, Finn RS, Qin S, Lenvatinib versus sorafenib in first-line treatment of patients with unresectable hepatocellular carcinoma: A randomised phase 3 non-inferiority trial: Lancet, 2018; 391; 1163-73
13. Horwitz E, Stein I, Andreozzi M, Human and mouse VEGFA-amplified hepatocellular carcinomas are highly sensitive to sorafenib treatment: Cancer Discov, 2014; 4; 730-43
14. Raoul JL, Adhoute X, Gilabert M, Edeline J, How to assess the efficacy or failure of targeted therapy: Deciding when to stop sorafenib in hepatocellular carcinoma: World J Hepatol, 2016; 8; 1541-46
15. Colaprico A, Silva TC, Olsen C, TCGAbiolinks: An R/Bioconductor package for integrative analysis of TCGA data: Nucleic Acids Res, 2016; 44; e71
16. Roessler S, Jia HL, Budhu A, A unique metastasis gene signature enables prediction of tumor relapse in early-stage hepatocellular carcinoma patients: Cancer Res, 2010; 70; 10202-12
17. Liberzon A, Subramanian A, Pinchback R, Molecular signatures database (MSigDB) 3.0: Bioinformatics, 2011; 27; 1739-40
18. Wilkerson MD, Hayes DN, ConsensusClusterPlus: A class discovery tool with confidence assessments and item tracking: Bioinformatics, 2010; 26; 1572-73
19. Finotello F, Mayer C, Plattner C, Molecular and pharmacological modulators of the tumor immune contexture revealed by deconvolution of RNA-seq data: Genome Med, 2019; 11; 34
20. Yu G, Wang LG, Han Y, He QY, clusterProfiler: An R package for comparing biological themes among gene clusters: OMICS, 2012; 16; 284-87
21. The Gene Ontology Consortium, The Gene Ontology Resource: 20 years and still GOing strong: Nucleic Acids Res, 2019; 47(D1); D330-38
22. Kanehisa M, Furumichi M, Tanabe M, KEGG: New perspectives on genomes, pathways, diseases and drugs: Nucleic Acids Res, 2017; 45; D353-61
23. Friedman J, Hastie T, Tibshirani R, Regularization paths for generalized linear models via coordinate descent: J Stat Softw, 2010; 33; 1-22
24. Heagerty PJ, Lumley T, Pepe MS, Time-dependent ROC curves for censored survival data and a diagnostic marker: Biometrics, 2000; 56; 337-44
25. Gajewski TF, Schreiber H, Fu YX, Innate and adaptive immune cells in the tumor microenvironment: Nat Immunol, 2013; 14; 1014-22
26. Ye QH, Qin LX, Forgues M, Predicting hepatitis B virus-positive metastatic hepatocellular carcinomas using gene expression profiling and supervised machine learning: Nat Med, 2003; 9; 416-23
27. Lei X, Lei Y, Li JK, Immune cells within the tumor microenvironment: Biological functions and roles in cancer immunotherapy: Cancer Lett, 2020; 470; 126-33
28. Balkwill FR, Capasso M, Hagemann T, The tumor microenvironment at a glance: J Cell Sci, 2012; 125; 5591-6
29. Viallard C, Larrivée B, Tumor angiogenesis and vascular normalization: Alternative therapeutic targets: Angiogenesis, 2017; 20; 409-26
30. Hilmi M, Neuzillet C, Calderaro J, Angiogenesis and immune checkpoint inhibitors as therapies for hepatocellular carcinoma: Current knowledge and future research directions: J Immunother Cancer, 2019; 7; 333
31. Vanhaesebroeck B, Guillermet-Guibert J, Graupera M, Bilanges B, The emerging mechanisms of isoform-specific PI3K signalling: Nat Rev Mol Cell Biol, 2010; 11; 329-41
32. Zhou Y, Li Y, Xu S, Eukaryotic elongation factor 2 kinase promotes angiogenesis in hepatocellular carcinoma via PI3K/Akt and STAT3: Int J Cancer, 2020; 146; 1383-95
33. Chaffer CL, Weinberg RA, A perspective on cancer cell metastasis: Science, 2011; 331; 1559-64
34. Mohan V, Das A, Sagi I, Emerging roles of ECM remodeling processes in cancer: Semin Cancer Biol, 2020; 62; 192-200
35. Marchand M, Monnot C, Muller L, Germain S, Extracellular matrix scaffolding in angiogenesis and capillary homeostasis: Semin Cell Dev Biol, 2019; 89; 147-56
36. Zhang C, Zhang Z, Zhu Y, Qin S, Glucose-6-phosphate dehydrogenase: A biomarker and potential therapeutic target for cancer: Anticancer Agents Med Chem, 2014; 14; 280-89
37. Lu M, Lu L, Dong Q, Elevated G6PD expression contributes to migration and invasion of hepatocellular carcinoma cells by inducing epithelial-mesenchymal transition: Acta Biochim Biophys Sin (Shanghai), 2018; 50; 370-80
38. Gobin E, Bagwell K, Wagner J, A pan-cancer perspective of matrix metalloproteases (MMP) gene expression profile and their diagnostic/prognostic potential: BMC Cancer, 2019; 19; 581
39. Kim E, Kim D, Lee JS, Capicua suppresses hepatocellular carcinoma progression by controlling the ETV4-MMP1 axis: Hepatology, 2018; 67; 2287-301
40. Psallidas I, Stathopoulos GT, Maniatis NA, Secreted phosphoprotein-1 directly provokes vascular leakage to foster malignant pleural effusion: Oncogene, 2013; 32; 528-35
41. Shin HD, Park BL, Cheong HS, SPP1 polymorphisms associated with HBV clearance and HCC occurrence: Int J Epidemiol, 2007; 36; 1001-8
42. Liu C, Zhou X, Zeng H, HILPDA is a prognostic biomarker and correlates with macrophage infiltration in pan-cancer: Front Oncol, 2021; 11; 597860
43. Huang A, Yang XR, Chung WY, Targeted therapy for hepatocellular carcinoma: Signal Transduct Target Ther, 2020; 5; 146
Figures
Figure 1. Identification of active angiogenesis subtype and inactive angiogenesis subtype. (A) Cumulative distribution function (CDF) curve with K value 2 to 6. (B) CDF Delta area curve for K=2 to 6. (C) VEGF expression of G1, G2, G3, G4. (D) Kaplan-Meier survival curves for G1 and G4. (R software Version 4.0.3, http://www.r-project.org).Figure 2. Immune status in active and inactive angiogenesis subtypes. (A) Immune infiltration status in active angiogenesis and inactive subtypes. (B) M2 microphage related genes expression status in active and inactive angiogenesis subtypes.* P<0.05; ** P<0.01; *** P<0.001. (R software Version 4.0.3, http://www.r-project.org).Figure 3. Acquisition of DEGs between active angiogenesis subtype and inactive subtype and related functional enrichment analysis. (A) Volcano plots of DEGS between active angiogenesis subtype and inactive subtype. (B) Heatmap of DEGS between active angiogenesis subtype and inactive subtype. (C) KEGG enrichment of upregulated genes in active angiogenesis subtype. (D) GO enrichment of upregulated genes in active angiogenesis subtype. (E) KEGG enrichment of downregulated genes in active angiogenesis subtype. (F) GO enrichment of downregulated genes in active angiogenesis subtype. (R software Version 4.0.3, http://www.r-project.org).Figure 4. Construction of the angiogenesis-based gene risk model. (A) LASSO coefficient. (B) The partial likelihood deviance plot. (C) Risk score distribution. (D) Overall survival time of HCC patients. (E) Heatmap of 13 prognostic-related genes. (F) Kaplan-Meier survival analysis in the high- and low-risk groups. (G) ROC curve for the 1-, 3-, 5-year survival rates of HCC patients. (R software Version 4.0.3, http://www.r-project.org).Figure 5. Validation of the prognostic model in the external validation set GSE14520 and ICGC-JP. (A) Kaplan-Meier plots in high- and low-risk groups in GSE14520. (B) ROC curves for 1-, 3-, 5-year OS prediction in GSE14520. (C) Kaplan-Meier plots in high- and low-risk groups in ICGC-JP. (D) ROC curves for 1-,3-,5-year OS prediction in ICGC-JP. (R software Version 4.0.3, http://www.r-project.org).Figure 6. Correlation between the risk score (including prognostic model component genes) and immune features. (R software Version 4.0.3, http://www.r-project.org).Figure 7. CDCA8 has the higher expression level in HCC cell line. (A) CDCA8 has the highest absolute value of coefficient in all prognostic model component genes. (B) CDCA8 expression was examined by quantitative real-time PCR assay in HCC cell line and normal liver cell line. (GraphPad Prism 8 Version 8.3.0, GraphPad).Figure 8. Flow chart of the study. (Adobe Illustrator Version 2020, Adobe). In Press
21 Mar 2024 : Meta-Analysis
Economic Evaluation of COVID-19 Screening Tests and Surveillance Strategies in Low-Income, Middle-Income, a...Med Sci Monit In Press; DOI: 10.12659/MSM.943863
10 Apr 2024 : Clinical Research
Predicting Acute Cardiovascular Complications in COVID-19: Insights from a Specialized Cardiac Referral Dep...Med Sci Monit In Press; DOI: 10.12659/MSM.942612
06 Mar 2024 : Clinical Research
Enhanced Surgical Outcomes of Popliteal Cyst Excision: A Retrospective Study Comparing Arthroscopic Debride...Med Sci Monit In Press; DOI: 10.12659/MSM.941102
06 Mar 2024 : Clinical Research
Prevalence and Variation of Medical Comorbidities in Oral Surgery Patients: A Retrospective Study at Jazan ...Med Sci Monit In Press; DOI: 10.12659/MSM.943884
Most Viewed Current Articles
17 Jan 2024 : Review article
Vaccination Guidelines for Pregnant Women: Addressing COVID-19 and the Omicron VariantDOI :10.12659/MSM.942799
Med Sci Monit 2024; 30:e942799
14 Dec 2022 : Clinical Research
Prevalence and Variability of Allergen-Specific Immunoglobulin E in Patients with Elevated Tryptase LevelsDOI :10.12659/MSM.937990
Med Sci Monit 2022; 28:e937990
16 May 2023 : Clinical Research
Electrophysiological Testing for an Auditory Processing Disorder and Reading Performance in 54 School Stude...DOI :10.12659/MSM.940387
Med Sci Monit 2023; 29:e940387
01 Jan 2022 : Editorial
Editorial: Current Status of Oral Antiviral Drug Treatments for SARS-CoV-2 Infection in Non-Hospitalized Pa...DOI :10.12659/MSM.935952
Med Sci Monit 2022; 28:e935952