31 March 2022: Database Analysis
Blood Pressure Trajectory and Its Influencing Factors in Chinese Adults: A Cohort Study with Long-Term Follow-Up
Chaoyong Yao1ABCDEF*, Zhibao Wei1BCDDOI: 10.12659/MSM.934886
Med Sci Monit 2022; 28:e934886


Abstract
BACKGROUND: Few studies have been reported on the factors affecting the trajectory of blood pressure in Chinese adults. This study aimed to identify the pattern of blood pressure trajectories and analyze the factors affecting different trajectories.
MATERIAL AND METHODS: A total of 749 participants were included in this study from the China Health and Nutrition Survey (CHNS) database, collected between 1989 and 2006, and were followed up until 2015. A group-based trajectory model was used to identify similar development trajectories of blood pressure levels. Univariate and multivariate logistic regression analysis was used to explore the influencing factors of blood pressure trajectories.
RESULTS: Three systolic (SBP) and diastolic blood pressure (DBP) trajectory groups were identified: Group 1, “low initial blood pressure and slight rise” (SBP, n=267, 35.65%); Group 2, “low initial blood pressure and moderate rise” (SBP, n=375, 50.07%); and Group 3, “high initial blood pressure and high rise” (SBP, n=107, 14.29%). In the SBP trajectory groups, age ³40 years, male sex, body mass index (BMI) ≥24 kg/m², and the eastern region of China were associated with a rapid rise and high baseline blood pressure (P<0.01). In terms of DBP trajectory, male sex, BMI ≥24 kg/m², and the eastern region of China were also related to the rapid rise and high baseline blood pressure, while age may not affect rise rate (P<0.01).
CONCLUSIONS: Different blood pressure trajectories and related influencing factors may provide information for targeted interventions, especially for people with high initial blood pressure and high rise.
Keywords: Blood Pressure, database, Risk Factors, Adult, Blood Pressure Determination, China, Cohort Studies, Follow-Up Studies, Humans, Hypertension, Male
Background
High blood pressure is associated with the prevalence and mortality of vascular diseases [1]. In 2017, there were an estimated 10.4 million deaths worldwide associated with higher systolic blood pressure (SBP, 110–115 mmHg) [2]. A large nationally representative survey showed that 23.2% of Chinese adults have hypertension [3]. The impact of blood pressure on an individual’s health is a matter of concern in China. Previous studies on the relationship between blood pressure and vascular diseases were mainly based on single or a small amount of blood pressure measurements [4,5]. Long-term blood pressure monitoring is a better indicator of an individual’s health than is a single measurement [6]. Long-term changes in an individual’s blood pressure over time can provide information for disease prevention and treatment.
Blood pressure trajectory can reflect long-term changes in an individual’s blood pressure. Several studies have assessed the association between blood pressure trajectory and cardiovascular diseases [7–9]. However, these studies were limited to short-term changes in blood pressure, such as in childhood, adulthood, and middle age. There was little evidence of blood pressure trajectory patterns over a longer period. In addition, studies on blood pressure trajectories have been more focused on SBP [7,10], while there are few studies on DBP. Hao et al indicated that there were differences in the relationship of SBP and DBP with disease [8]. Furthermore, current studies have been mostly about the relationship between blood pressure trajectory and disease, and there are few studies on the factors affecting different blood pressure trajectory patterns.
In this study, we aimed to identify the pattern of the blood pressure trajectory in Chinese adults based on the China Health and Nutrition Survey (CHNS) database with long-term follow-up data and to analyze the factors that may affect the blood pressure trajectories.
Material and Methods
STUDY DESIGN AND POPULATION:
This was a retrospective cohort study. All data were extracted from the CHNS database, which is an ongoing large-scale household survey that has been conducted since 1989 and was followed up every 2 to 4 years until 2015 [11]. We extracted data between 1989 and 2006. A multistage, random clustering process was used to draw the samples surveyed in 9 provinces (east: Shandong and Jiangsu; central: Henan, Hubei, and Hunan; west: Guangxi and Guizhou; northeast: Heilongjiang and Liaoning). The exclusion criteria were as follows: (1) age <18 years old; (2) diagnosed with hypertension at baseline; (3) without complete blood pressure data; and (4) lost follow-up. In addition, to extrapolate the results to the general population, 5 participants with diabetes were excluded. All included participants had complete follow-up data collected for 10 consecutive times. The survey protocols, instruments, and process for obtaining informed consent for CHNS were approved by the Ethics Committee of the National Institute of Nutrition and Food Safety of the Chinese Center for Disease Control and Prevention and the Institutional Review Board of the University of North Carolina at Chapel Hill [12].
BLOOD PRESSURE MEASUREMENT:
In each measurement, the participants remained seated after resting for at least 5 min. All trained health workers or nurses followed the standardized procedure using a calibrated mercury sphygmomanometer and measured the blood pressure of the participant’s right arm. Blood pressure was measured 3 times at 30-s intervals, and the mean of the 3 measurements was used as the measured value. SBP was measured when the pulse sound first appeared (Korotkoff phase 1), and DBP was measured when the pulse sound disappeared (Korotkoff phase 5) [13].
OTHER VARIABLES:
Demographic data of participants were collected and included age (<30, 30–39, and ≥40 years), sex (male or female), body mass index (BMI <24kg/m2, not overweight/obesity; BMI ≥24 kg/m2, overweight/obesity), waist-hip ratio (WHR, normal, WHR <0.9 in men or WHR<0.85 in women; central obesity, WHR ≥0.9 in men or WHR ≥0.85 in women), education level (illiteracy, primary school, middle school, and high school or above), history of smoking (yes or no), alcohol consumption (yes or no), diabetes mellitus (yes or no), region (east, center, and west), and type of residence (rural or urban).
TRAJECTORY GROUPING:
A group-based trajectory model was used to identify similar development trajectories of blood pressure levels [14]. We modeled the blood pressure trajectories of all recruited participants. First, a base model without covariate was constructed to determine the number of groups and the order of the polynomial functions of the survey wave. The best-fit model was considered to be the trajectory group with the highest probability and was based on the goodness of fit statistic using the Bayesian information criterion (BIC) (the one with the absolute value of BIC closest to zero was selected as the appropriate model). The BIC results indicated that the model with 3 groups with up to cubic order terms fitted the best (Supplementary Figure 1). Second, each participant was assigned to the corresponding trajectory group according to the maximum likelihood estimation to estimate the probability of variance generated blood pressure of each group.
STATISTICAL ANALYSIS:
Measures of central tendency such as mean ± standard deviation was used to analyze the data with a normal distribution, and the
All statistical analyses were done using a 2-sided test, and
Results
CHARACTERISTICS OF PARTICIPANTS:
A total of 749 participants were included in this study (Figure 1). Of these participants, 275 (36.72%) were men, 474 (63.28%) were women. The age distribution of individuals aged <30, 30–39, and ≥40 years old was 25.10% (188 participants), and 49.53% (371 participants), and 25.37% (190 participants), respectively. There were 653 (87.18%) participants with overweight/obesity, and 96 (12.82%) participants without overweight/obesity. From a regional perspective, there were 298 (39.79%) participants in eastern China, 328 (43.79%) participants in central China, and 123 (16.42%) participants in western China (Table 1).
CHARACTERISTICS OF THE BLOOD PRESSURE TRAJECTORY GROUPS:
To characterize each group’s blood pressure trajectory, the initial blood pressure values (initial BP), the last follow-up blood pressure values (end BP), and the average annual percent change (AAPC) of each trajectory were added.
Three separate trajectories in SBP were identified (Figure 2A) and called “low initial BP and slight rise”, “low initial BP and moderate rise”, and “high initial BP and high rise”. The low initial BP and slight rise group (Group 1; initial BP, 103.25±10.64 mmHg; end BP, 118.52±11.39 mmHg; AAPC, 0.5% [95% CI, 0.4–0.7]; n=267, 35.65%) was characterized by maintaining a relatively low SBP level and slowly increasing. The low initial BP and moderate rise group (Group 2; initial BP, 111.47±11.42 mmHg; end BP, 137.62±15.24 mmHg; AAPC, 0.8% [95% CI, 0.7–0.9]; n=375, 50.07%) was characterized by a relatively low SBP level and faster increase than Group 1. The high initial BP and high rise group (Group 3; initial BP, 121.14±14.17 mmHg; end BP, 154.51±17.15 mmHg; AAPC, 1.1% [95% CI, 0.9–1.2]; n=107, 14.29%) was characterized by a relatively high and rapid increase in SBP level. Consistent with the SBP trajectories, 3 isolated trajectory groups were identified in DBP (Figure 2B). The numbers and proportions of participants in the low initial BP and slight rise (Group 1; initial BP, 65.49±7.95 mmHg; end BP, 74.98±7.77 mmHg; AAPC, 0.4% [95% CI, 0.3–0.6]), high initial BP and slight rise [Group 2; initial BP, 73.07±8.50 mmHg; end BP, 80.10±7.44 mmHg; AAPC, 0.4% [95% CI, 0.3–0.5]), and high initial BP and high rise (Group 3; initial BP, 75.98±9.34 mmHg; end BP, 90.82±10.13 mmHg; AAPC, 0.8% [95% CI, 0.6–0.9]) groups were 305 (40.72%), 366 (48.87%), and 78 (10.41%), respectively. The detailed characteristics of each SBP and DBP trajectory group are displayed in Table 2.
COMPARISON OF CHARACTERISTICS BETWEEN DIFFERENT BLOOD PRESSURE TRAJECTORY GROUPS:
The results showed that there were statistical differences between different SBP and DBP trajectory groups in age (SBP: χ2=42.131, P<0.001; DBP: χ2=10.289, P=0.036), regional distribution (SBP: χ2=37.698, P<0.001; DBP: χ2=37.088, P<0.001), sex (SBP: χ2=18.860, P<0.001; DBP: χ2=23.420, P<0.001), BMI (SBP: χ2=17.637, P<0.001; DBP: χ2=19.025, P<0.001), and alcohol consumption (SBP: χ2=6.250, P=0.044; DBP: χ2=9.689, P=0.008). Detailed analyses are shown in Tables 3 and 4.
SBP AND DBP TRAJECTORIES IN DIFFERENT PARTICIPANTS:
The trajectories of SBP and DBP among different participants are shown in Figure 3. In the age subgroup, participants aged ≥40 years and 30–39 years had higher SBP levels than did participants aged <30 years (P<0.05), while no statistical differences were observed in DBP levels (P>0.05; Figure 3A). Men had higher SBP and DBP levels than women, but there were no statistically significant differences (P>0.05; Figure 3B). In terms of BMI, participants with BMI ≥24kg/m2 had higher SBP and DBP levels than did those with BMI <24kg/m2, but no significant difference was observed (P>0.05; Figure 3C). In terms of regional distribution, participants located in the eastern region had the highest SBP and DBP levels, and the only significant difference in DBP levels was between the the eastern region and western region (P<0.05); no other comparisons were significant (P>0.05; Figure 3D).
FACTORS ASSOCIATED WITH DBP AND SBP TRAJECTORY GROUPS:
The factors associated with the DBP trajectory groups are shown in Figure 4. In the comparison between Group 2 and Group 1 (Model 1), Group 2 had more men [odds ratio (OR)=2.17; 95% confidence interval (CI), 1.55–3.06], BMI ≥24kg/m2 (OR=1.84; 95% CI, 1.09–3.11), while Group 1 had more participants located in the central region (OR=0.53; 95% CI, 0.38–0.76) and western region (OR=0.28; 95% CI, 0.17–0.44). In the comparison between Group 3 and Group 1 (Model 2), participants aged ≥40 years (OR=3.27; 95% CI, 1.50–7.13), male sex (OR=2.90; 95% CI, 1.66–5.07), and BMI ≥24kg/m2 (OR=4.59; 95% CI, 2.28–9.25) were associated with the Group 3 DBP trajectory and participants located in central region (OR=0.56; 95% CI, 0.31–0.99) and western region (OR=0.24; 95% CI, 0.10–0.58) were associated with the DBP trajectory in Group 1.
The factors related to the SBP trajectory are shown in Figure 5. The Group 2 SBP trajectory was associated with aged ≥40 years (OR=2.26; 95% CI, 1.39–3.69), male sex (OR=2.12; 95% CI, 1.49–3.02), and BMI ≥24kg/m2 (OR=2.22; 95% CI, 1.26–3.92), while the Group 1 SBP trajectory was associated with central region (OR=0.64; 95% CI, 0.44–0.92) and western region (OR=0.29; 95% CI, 0.18–0.47). Similar to the Group 2 SBP trajectory, the Group 3 SBP trajectory was associated with age 30–39 years (OR=2.85; 95% CI, 1.36–5.98) and ≥40 years (OR=11.08; 95% CI, 4.99–24.58), male sex (OR=2.31; 95% CI, 1.33–4.02), and BMI ≥24kg/m2 (OR=4.66; 95% CI, 2.17–9.98), and the Group 1 SBP trajectory was associated with participants living in the central region (OR=0.48; 95% CI, 0.28–0.83) and western region (OR=0.10; 95% CI, 0.04–0.26).
Discussion
In this study, the blood pressure trajectory of Chinese adults and its influencing factors were analyzed based on the long-term follow-up data of the CHNS database. Our results indicated that the SBP and DBP trajectories of Chinese adults can be divided into 3 groups. In the SBP trajectory, age ≥40 years, male sex, BMI ≥24kg/m2, and eastern regions may be factors that affected the rapid rise and high baseline blood pressure. In terms of DBP trajectory, male sex, BMI ≥24kg/m2, and eastern region were also associated with the rapid rise and high baseline blood pressure, while age may not affect the rise of DBP trajectory.
High blood pressure is an important factor for certain diseases, such as cardiovascular diseases [15]. A single blood pressure measurement may not be sufficient to characterize long-term disease prediction, and blood pressure trajectory is a good indicator of long-term changes [16,17]. Three blood pressure trajectories of Chinese adults were shown in this study. The blood pressure trajectories of Group 1 and Group 2 reflected the blood pressure trajectories of normal people with different rates of increase, while Group 3 reflected the blood pressure trajectories of patients who may have hypertension. Different blood pressure trajectories were associated with different risks of the same disease [10,16]. Shen et al indicated that adult hypertension can originate in childhood, and the long-term blood pressure levels of patients with hypertension were higher than that of the normal population [18]. Understanding the differences in blood pressure between individuals over time can provide information for tailored prevention and treatment strategies.
We compared the differences between different blood pressure trajectory groups to find factors that may affect blood pressure trajectory. Our results showed that male sex, BMI ≥24 kg/m2, and eastern regions were related to the rapid rise and high baseline blood pressure of the SBP and DBP trajectories. In addition, age ≥40 years may affect the SBP trajectory but not the DBP trajectory. The study of Cheng et al indicated that older age, male sex, and high BMI were positively associated with an increase in all blood pressure measures [19]. The influence of sex on blood pressure is controversial. A meta-analysis showed that men have higher blood pressure levels than women in most populations [20], and these results were consistent with our results. However, a large-sample multi-center study showed that the blood pressure trajectory of women exhibited a steeper increase than did that of men [21]. BMI was an important modifiable factor associated with high blood pressure trajectory [22]. Participants can reduce the risk of high blood pressure trajectory by lowering their BMI. Our results also found that participants located in eastern regions had a higher risk of high blood pressure trajectory than those located in central and western regions. The newest China Hypertension Survey indicated that participants in the southeast had the highest hypertension prevalence [23], which may support our results. Among these factors that affected blood pressure trajectory, BMI deserves significant attention because it is controllable.
Several studies have suggested that blood pressure trajectories are the important predictors of some disease morbidity and mortality as well as all-cause mortality among patients with different blood pressure levels [7,17]. Portegies et al discovered that rapidly increasing blood pressure trajectories are associated with a high risk of stroke and death [10]. Allen et al found that a higher blood pressure trajectory in youth is related to an increased risk of coronary artery calcification in middle age [24]. The study of Zheng et al found that participants with higher and increasing blood pressure trajectories are more likely to develop subclinical renal disease in middle age [25]. Through the analysis of individual blood pressure trajectories, it may be possible to find the risk of some diseases earlier, and timely prevention and treatment are of great significance to disease control.
Our study divided the blood pressure trajectory of Chinese adults into 3 groups based on more than 20 years of follow-up data and analyzed the factors that affected the blood pressure trajectories. However, our study had some limitations. First, our sample size was not large compared with that of other studies. Also, owing to the long follow-up period, there were fewer eligible participants. Second, some factors, such as dietary patterns, have an important influence on blood pressure trajectory [26], but these factors were not included in this study.
Conclusions
Our study identified 3 SBP and DBP trajectories in Chinese adults and analyzed the influencing factors of blood pressure trajectory. Factors such as male sex, BMI ≥24 kg/m2, and eastern region were associated with the rapid increase and high baseline blood pressure of SBP and DBP trajectories, while age may not affect the rise of DBP trajectory. This study may provide information for the prevention and treatment of blood pressure-related diseases.
Figures
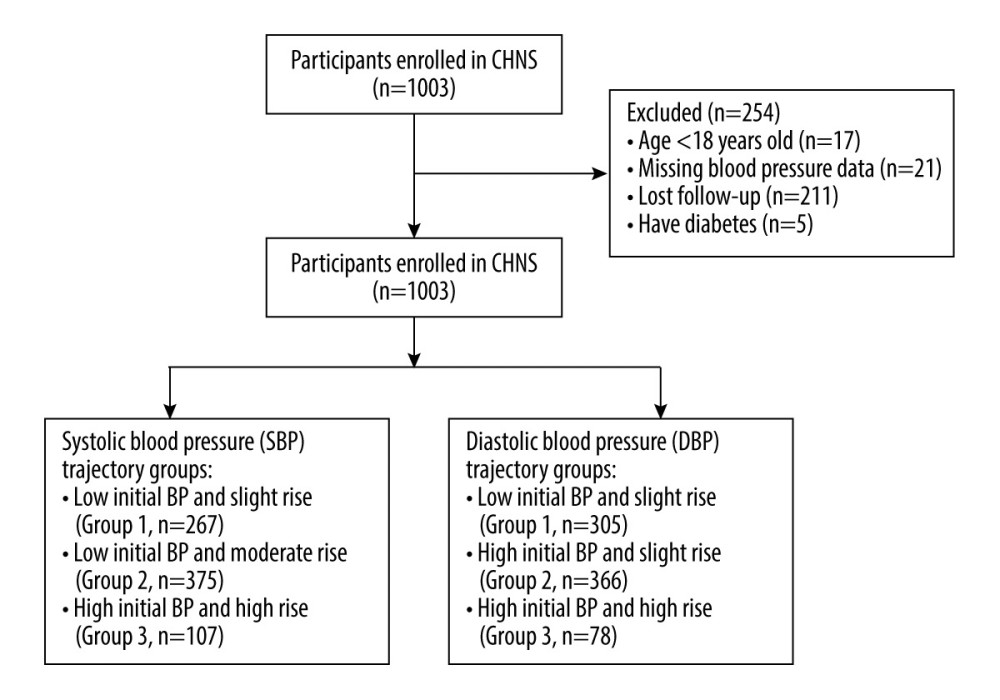 Figure 1. Flow chart of the study population.
 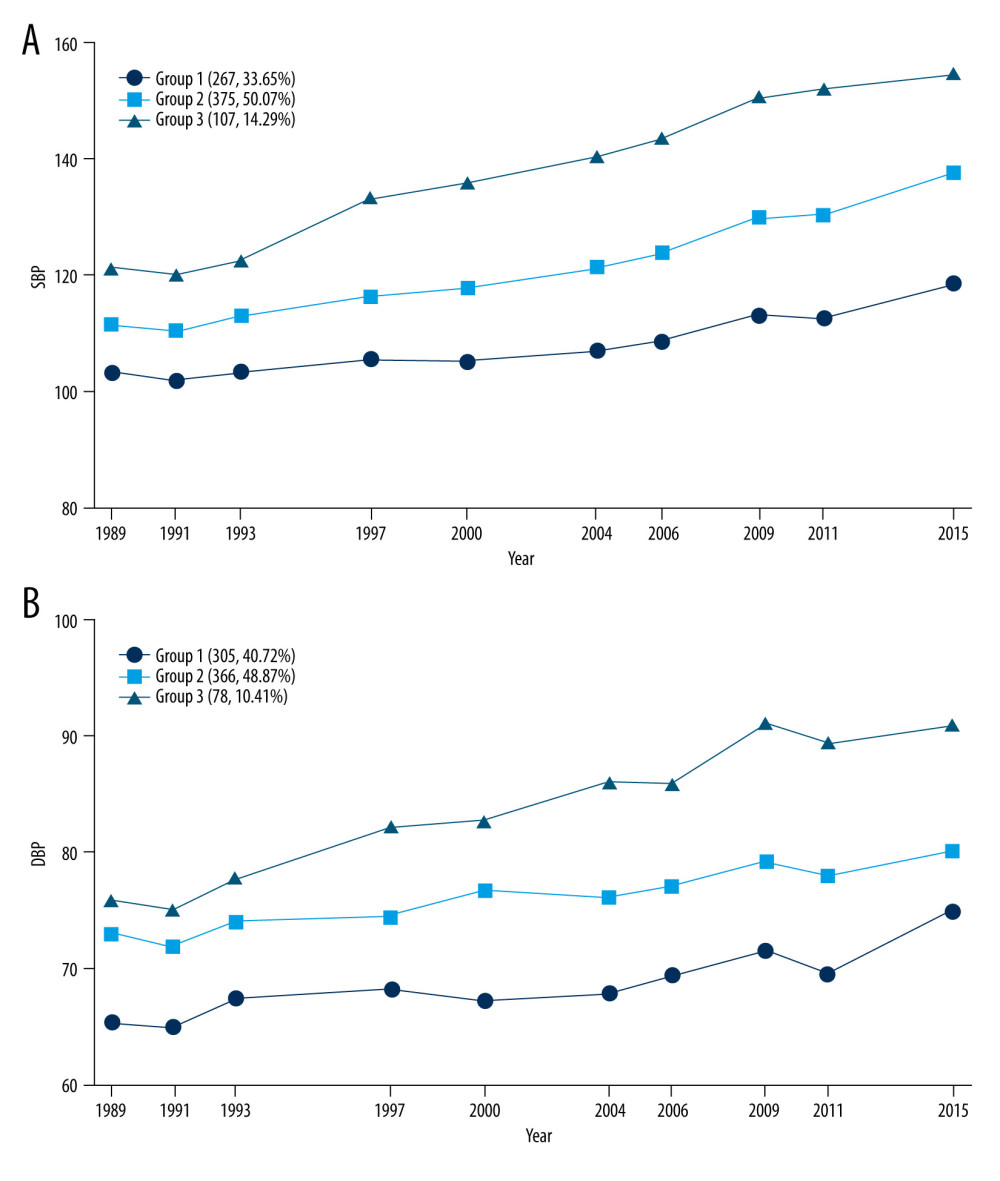 Figure 2. Trajectories in systolic (SBP) and diastolic blood pressure (DBP). (A) SBP trajectory groups; (B) DBP trajectory groups.
 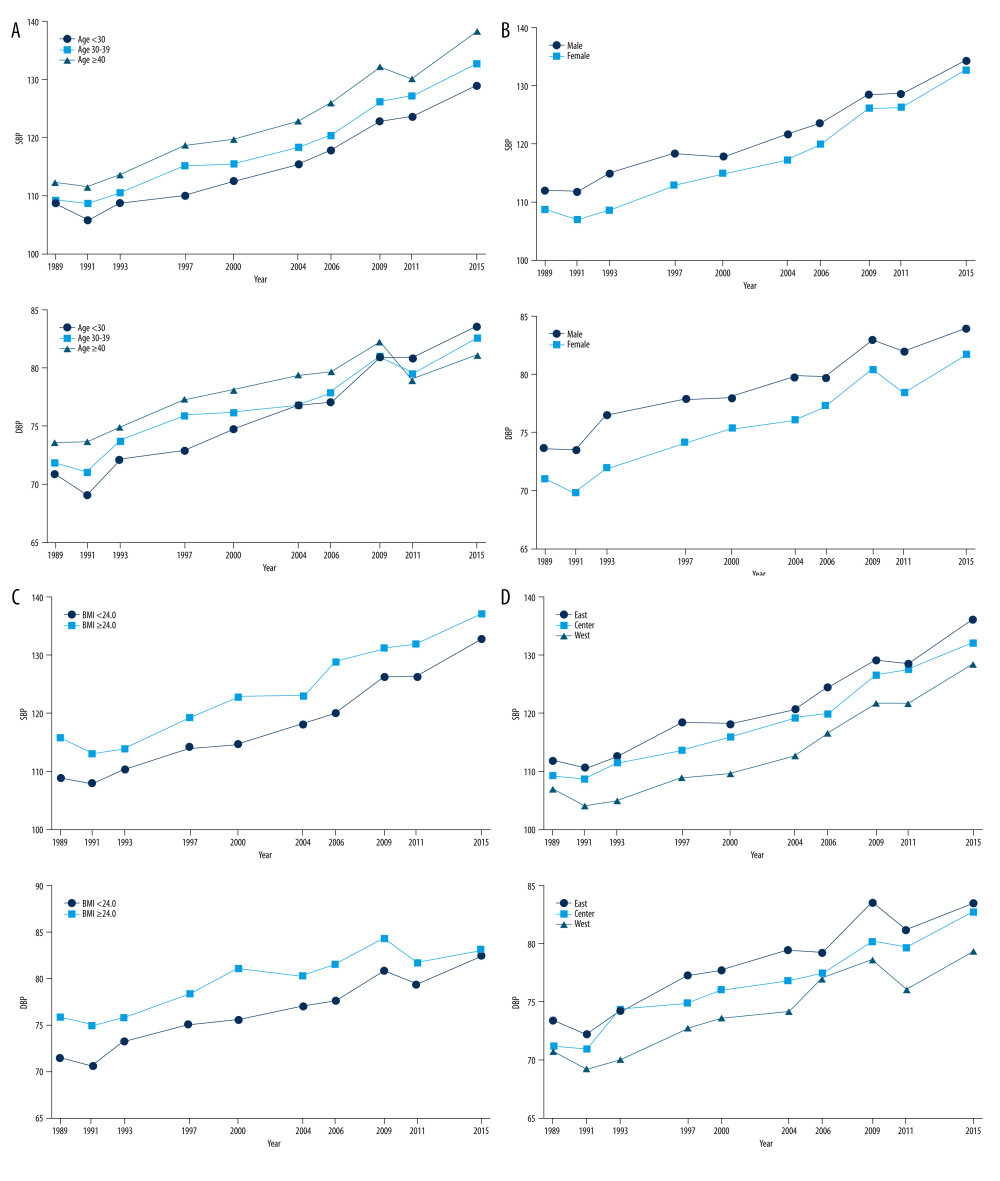 Figure 3. Systolic blood pressure (SBP) and diastolic blood pressure (DBP) trajectories in different populations. (A) SBP and DBP trajectories based on age; (B) SBP and DBP trajectories based on sex; (C) SBP and DBP trajectories based on body mass index; (D) SBP and DBP trajectories based on region.
 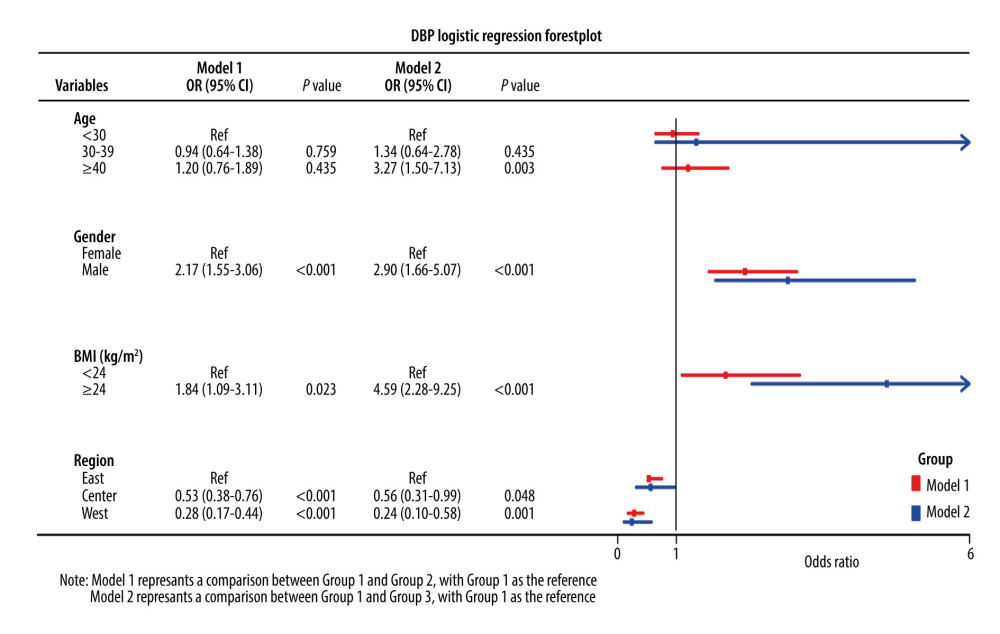 Figure 4. Logistic regression forest plot of the factors associated with the diastolic blood pressure trajectory groups.
 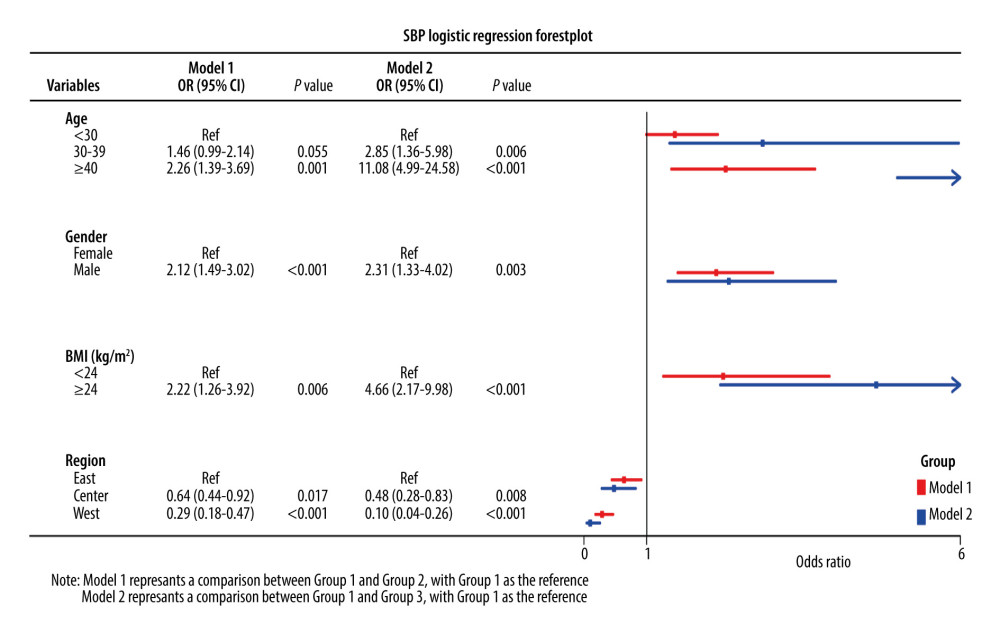 Figure 5. Logistic regression forest plot of the factors related to the systolic blood pressure trajectory groups.
 References
1. Xie X, Atkins E, Lv J, Effects of intensive blood pressure lowering on cardiovascular and renal outcomes: Updated systematic review and meta-analysis: Lancet, 2016; 387; 435-43
2. Stanaway J, Afshin A, Gakidou E, Global, regional, and national comparative risk assessment of 84 behavioural, environmental and occupational, and metabolic risks or clusters of risks for 195 countries and territories, 1990–2017: A systematic analysis for the Global Burden of Disease Study 2017: Lancet, 2018; 392; 1923-94
3. Wang Z, Chen Z, Zhang L, Status of hypertension in China: Results from the China hypertension survey, 2012–2015: Circulation, 2018; 137; 2344-56
4. Bundy JD, Li C, Stuchlik P, Systolic blood pressure reduction and risk of cardiovascular disease and mortality: A systematic review and network meta-analysis: JAMA Cardiol, 2017; 2; 775-81
5. Li Y, Wang DD, Ley SH, Potential impact of time trend of life-style factors on cardiovascular disease burden in China: J Am Coll Cardiol, 2016; 68; 818-33
6. Li W, Jin C, Vaidya A, Blood pressure trajectories and the risk of intracerebral hemorrhage and cerebral infarction: A prospective study: Hypertension, 2017; 70; 508-14
7. Theodore RF, Broadbent J, Nagin D, Childhood to early-midlife systolic blood pressure trajectories: Early-life predictors, effect modifiers, and adult cardiovascular outcomes: Hypertension, 2015; 66; 1108-15
8. Hao G, Wang X, Treiber FA, Blood pressure trajectories from childhood to young adulthood associated with cardiovascular risk: Results from the 23-year longitudinal Georgia Stress and Heart Study: Hypertension, 2017; 69; 435-42
9. Smitson CC, Scherzer R, Shlipak MG, Association of blood pressure trajectory with mortality, incident cardiovascular disease, and heart failure in the Cardiovascular Health Study: Am J Hypertens, 2017; 30; 587-93
10. Portegies ML, Mirza SS, Verlinden VJ, Mid- to late-life trajectories of blood pressure and the risk of stroke: The Rotterdam Study: Hypertension, 2016; 67; 1126-32
11. Zhang B, Zhai FY, Du SF, The China health and nutrition survey, 1989–2011: Obes Rev, 2014; 15(Suppl 1); 2-7
12. Carolina Population Center: China Health and Nutrition Survey Available from: http://www.cpc.unc.edu/projects/china
13. Zou Q, Wang H, Su C, Longitudinal association between physical activity and blood pressure, risk of hypertension among Chinese adults: China Health and Nutrition Survey 1991–2015: Eur J Clin Nutr, 2021; 75; 274-82
14. Nagin DS, Odgers CL, Group-based trajectory modeling in clinical research: Ann Rev Clin Psychol, 2010; 6; 109-38
15. Lacey B, Lewington S, Clarke R, Age-specific association between blood pressure and vascular and non-vascular chronic diseases in 0·5 million adults in China: A prospective cohort study: Lancet Glob Health, 2018; 6; e641-49
16. Petruski-Ivleva N, Viera AJ, Shimbo D, Longitudinal patterns of change in systolic blood pressure and incidence of cardiovascular disease: The Atherosclerosis Risk in Communities Study: Hypertension, 2016; 67; 1150-56
17. Tielemans SM, Geleijnse JM, Menotti A, Ten-year blood pressure trajectories, cardiovascular mortality, and life years lost in 2 extinction cohorts: The Minnesota Business and Professional Men Study and the Zutphen Study: J Am Heart Assoc, 2015; 4; e001378
18. Shen W, Zhang T, Li S, Race and sex differences of long-term blood pressure profiles from childhood and adult hypertension: The Bogalusa Heart Study: Hypertension, 2017; 70; 66-74
19. Cheng S, Xanthakis V, Sullivan LM, Blood pressure tracking over the adult life course: Patterns and correlates in the Framingham heart study: Hypertension, 2012; 60; 1393-99
20. de Munter JS, Agyemang C, van Valkengoed IG, Sex difference in blood pressure among South Asian diaspora in Europe and North America and the role of BMI: A meta-analysis: J Hum Hypertens, 2011; 25; 407-17
21. Ji H, Kim A, Ebinger JE, Sex differences in blood pressure trajectories over the life course: JAMA Cardiol, 2020; 5; 19-26
22. Fan H, Zhang X, Body mass index trajectory across childhood and subsequent risk of elevated blood pressure: J Clin Hypertens (Greenwich), 2020; 22; 1902-7
23. Pei L, Wu J, Wang Z, Geographic variations and potential macro-environmental exposure of hypertension: from the China hypertension survey: J Hypertens, 2020; 38; 829-38
24. Allen NB, Siddique J, Wilkins JT, Blood pressure trajectories in early adulthood and subclinical atherosclerosis in middle age: JAMA, 2014; 311; 490-97
25. Zheng W, Mu J, Chu C, Association of blood pressure trajectories in early life with subclinical renal damage in middle age: J Am Soc Nephrol, 2018; 29; 2835-46
26. Gao M, Wang F, Trajectories of mediterranean diet adherence and risk of hypertension in China: Results from the CHNS Study, 1997–2011: Nutrients, 2018; 10; 2014
Figures
Figure 1. Flow chart of the study population.Figure 2. Trajectories in systolic (SBP) and diastolic blood pressure (DBP). (A) SBP trajectory groups; (B) DBP trajectory groups.Figure 3. Systolic blood pressure (SBP) and diastolic blood pressure (DBP) trajectories in different populations. (A) SBP and DBP trajectories based on age; (B) SBP and DBP trajectories based on sex; (C) SBP and DBP trajectories based on body mass index; (D) SBP and DBP trajectories based on region.Figure 4. Logistic regression forest plot of the factors associated with the diastolic blood pressure trajectory groups.Figure 5. Logistic regression forest plot of the factors related to the systolic blood pressure trajectory groups. Tables
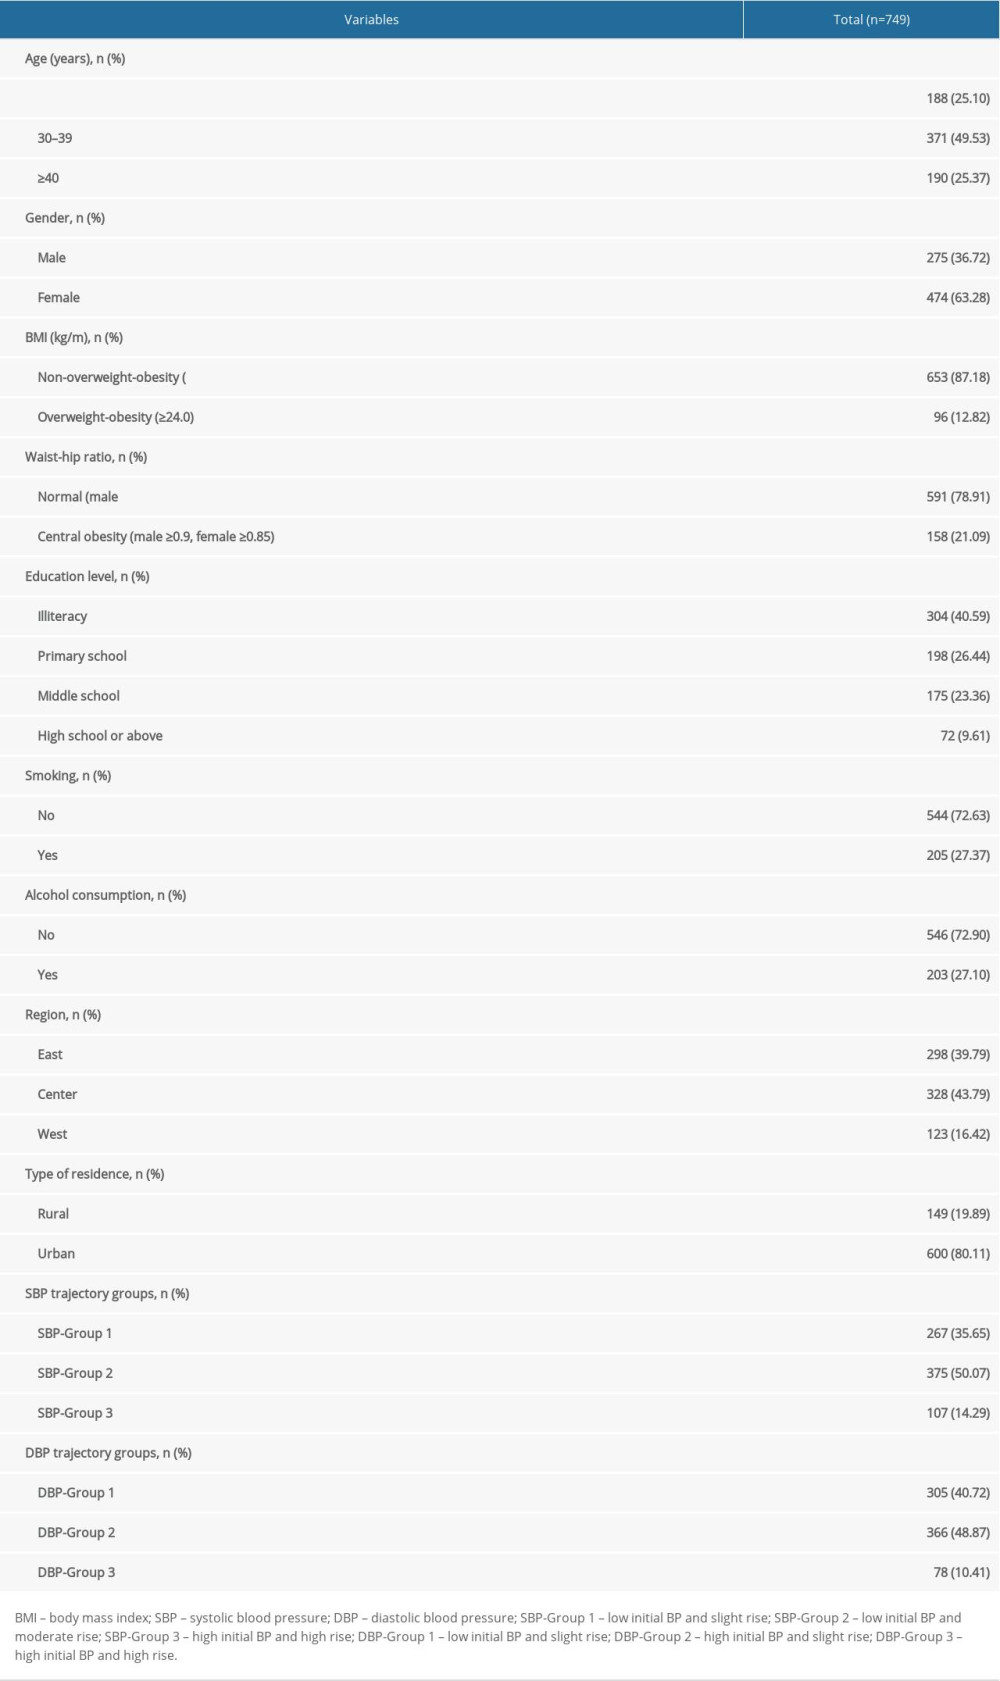 Table 1. Characteristics of all included participants.
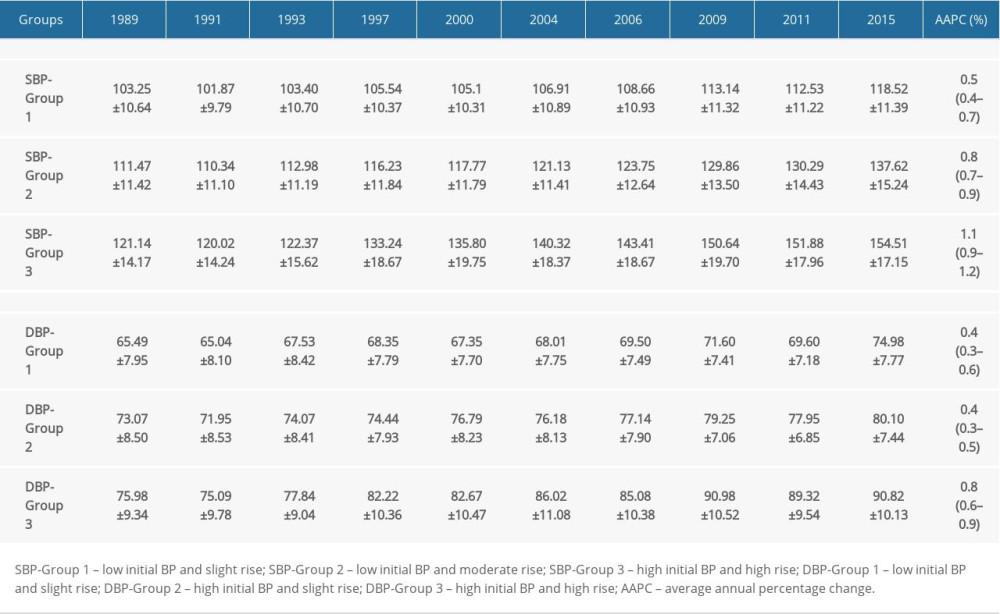 Table 2. Characteristics of each systolic blood pressure and diastolic blood pressure trajectory group.
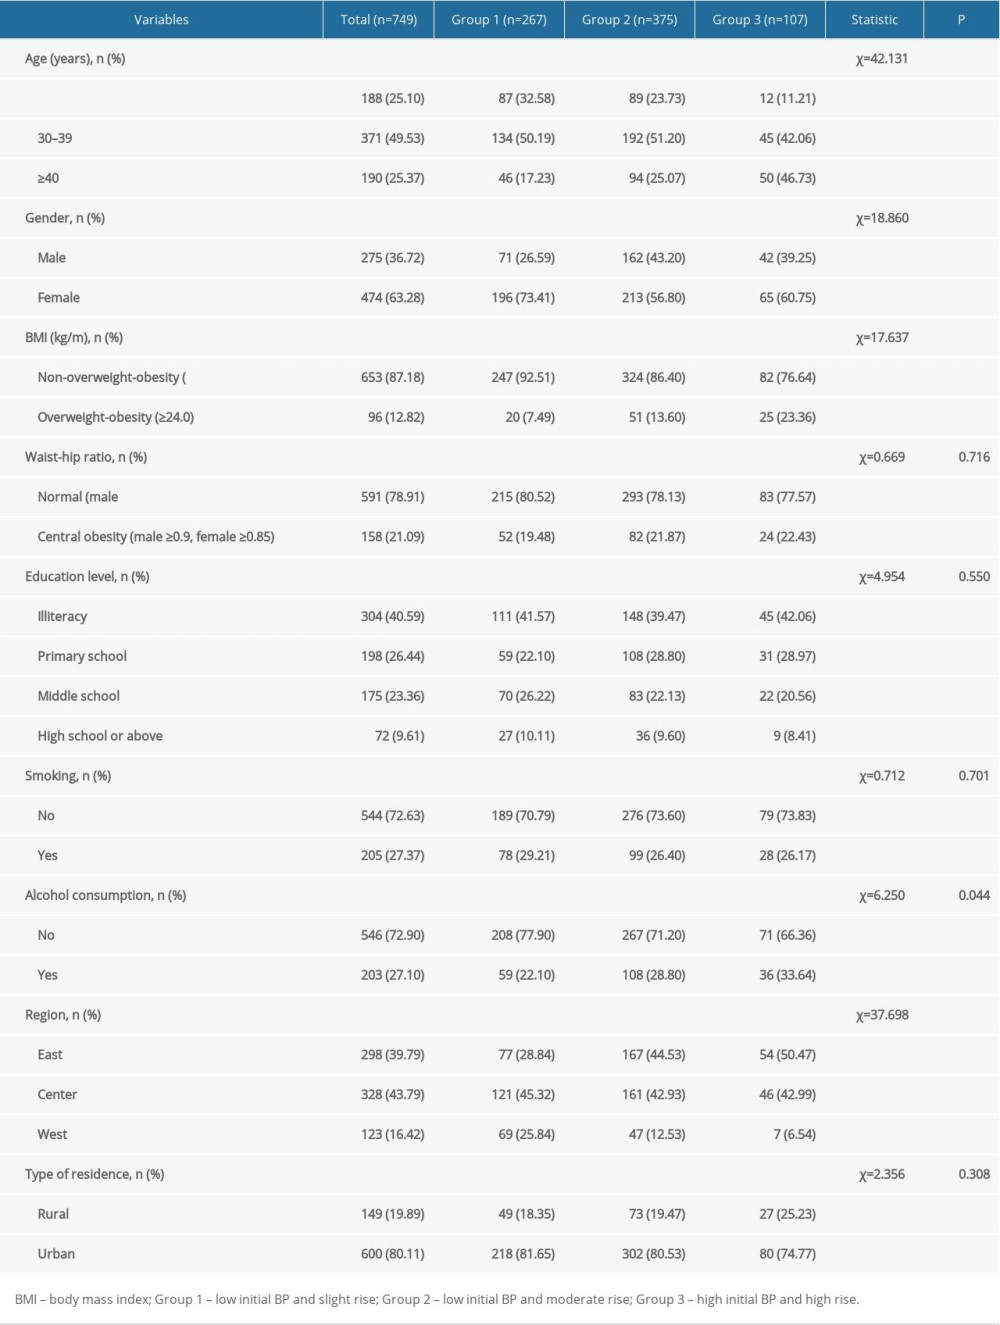 Table 3. Comparison of systolic blood pressure trajectory groups.
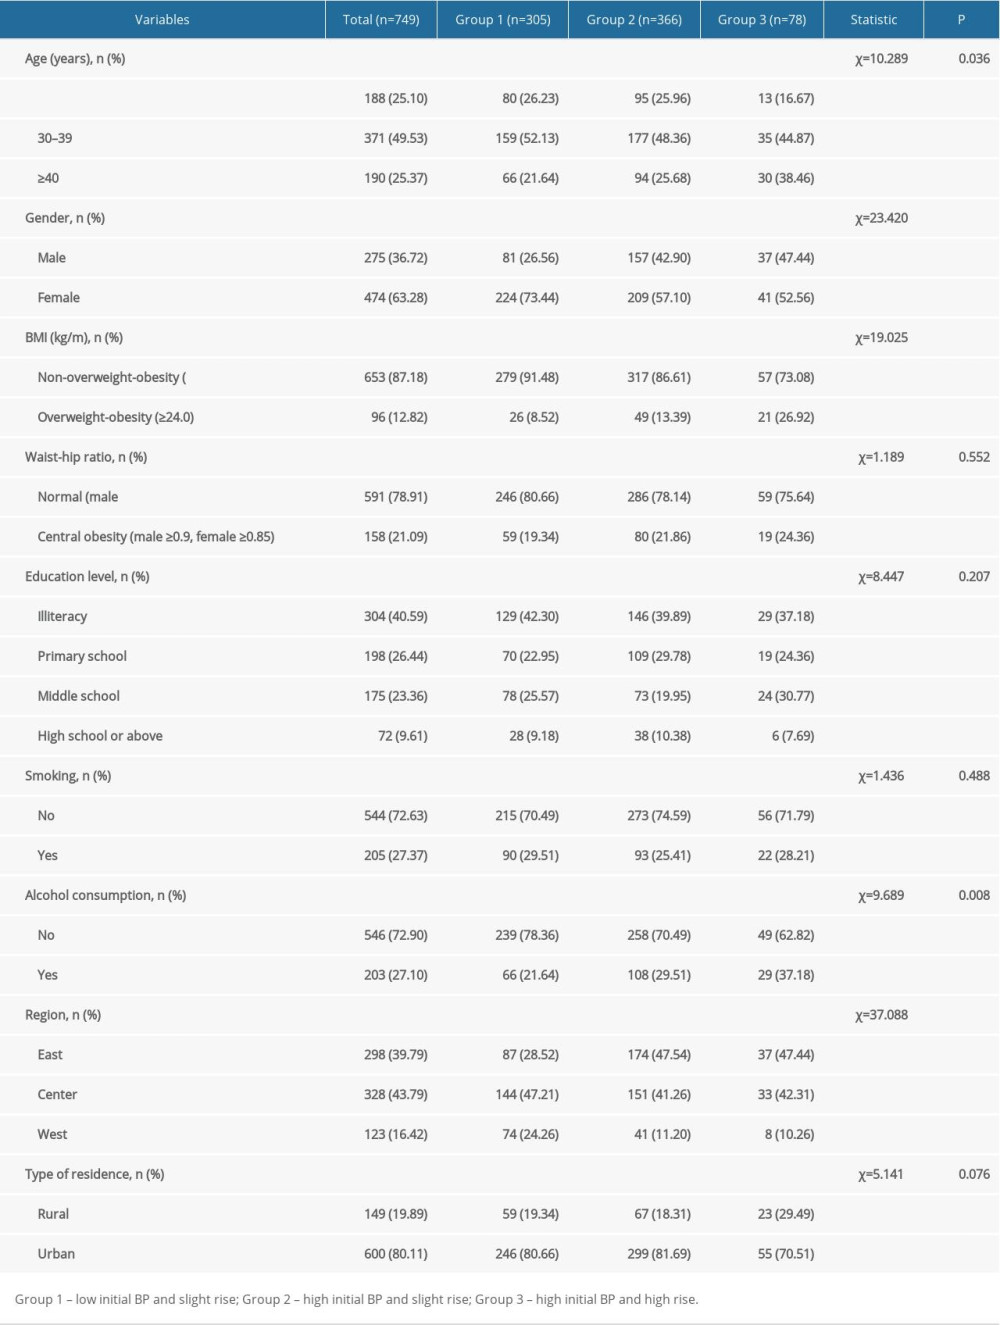 Table 4. Comparison of diastolic blood pressure trajectory groups.Table 1. Characteristics of all included participants.Table 2. Characteristics of each systolic blood pressure and diastolic blood pressure trajectory group.Table 3. Comparison of systolic blood pressure trajectory groups.Table 4. Comparison of diastolic blood pressure trajectory groups.
 In Press
21 Mar 2024 : Meta-Analysis
Economic Evaluation of COVID-19 Screening Tests and Surveillance Strategies in Low-Income, Middle-Income, a...Med Sci Monit In Press; DOI: 10.12659/MSM.943863
10 Apr 2024 : Clinical Research
Predicting Acute Cardiovascular Complications in COVID-19: Insights from a Specialized Cardiac Referral Dep...Med Sci Monit In Press; DOI: 10.12659/MSM.942612
06 Mar 2024 : Clinical Research
Enhanced Surgical Outcomes of Popliteal Cyst Excision: A Retrospective Study Comparing Arthroscopic Debride...Med Sci Monit In Press; DOI: 10.12659/MSM.941102
06 Mar 2024 : Clinical Research
Prevalence and Variation of Medical Comorbidities in Oral Surgery Patients: A Retrospective Study at Jazan ...Med Sci Monit In Press; DOI: 10.12659/MSM.943884
Most Viewed Current Articles
17 Jan 2024 : Review article
Vaccination Guidelines for Pregnant Women: Addressing COVID-19 and the Omicron VariantDOI :10.12659/MSM.942799
Med Sci Monit 2024; 30:e942799
14 Dec 2022 : Clinical Research
Prevalence and Variability of Allergen-Specific Immunoglobulin E in Patients with Elevated Tryptase LevelsDOI :10.12659/MSM.937990
Med Sci Monit 2022; 28:e937990
16 May 2023 : Clinical Research
Electrophysiological Testing for an Auditory Processing Disorder and Reading Performance in 54 School Stude...DOI :10.12659/MSM.940387
Med Sci Monit 2023; 29:e940387
01 Jan 2022 : Editorial
Editorial: Current Status of Oral Antiviral Drug Treatments for SARS-CoV-2 Infection in Non-Hospitalized Pa...DOI :10.12659/MSM.935952
Med Sci Monit 2022; 28:e935952