20 December 2021: Database Analysis
Identification of Feature Autophagy-Related Genes and DNA Methylation Profiles in Systemic Lupus Erythematosus Patients
Bo Gao1ACE*DOI: 10.12659/MSM.933425
Med Sci Monit 2021; 27:e933425


Abstract
BACKGROUND: The aim of this study was to identify feature autophagy-related genes (ARGs) in systemic lupus erythematosus (SLE), evaluate their diagnostic value, and further explore DNA methylation and expression levels in the pathogenesis of SLE.
MATERIAL AND METHODS: WGCNA was used to construct network and selected hub genes based on gene expression dataset GSE81622. ARGS were overlapped with hub genes, and feature ARGs were identified. A diagnostic model was established by these feature ARGs using LASSO. GSE96879 was used to analyze the methylation levels of feature ARGs. The expression and methylation levels of feature ARGs were verified using RT-PCR and methylation-specific PCR.
RESULTS: We found that 55 hub genes were highly connected to the red module of WGCNA, and ARGs were extracted from the Human Autophagy Database and the GO_AUTOPHAGY gene set. Overlapping of 55 hub gene with ARGs resulted in 18 feature ARGs. S100A8, MyD88, and NCR3 from the 18 feature ARGs showed higher good diagnostic value for SLE. Five differentially methylated positions locating to S100A8, MyD88, and NCR3 genes were identified from GSE96879. After validation tests, RT-PCR showed that gene expressions of MyD88 and S100A8 were increased in the PBMCs samples of SLE patients compared with healthy controls, whereas NCR3 was the opposite. MSP found that cg24898863 (S100A8) was hypomethylated, while cg27490128 (NCR3) was hypermethylated in the SLE group, and S100A8 and NCR3 methylation were positively correlated with their expressions.
CONCLUSIONS: Our present study identified the potential roles of feature ARGs in SLE diagnosis, and shows correlation among DNA methylation and gene expressions of these feature ARGs in SLE.
Keywords: Diagnosis, Computer-Assisted, DNA Methylation, Panniculitis, Lupus Erythematosus, Adult, Female, Genes, Genetic Markers, Genetic Predisposition to Disease, Humans, Lupus Erythematosus, Systemic, Male, Oligonucleotide Array Sequence Analysis, Polymerase Chain Reaction, Risk Factors
Background
Systemic lupus erythematosus (SLE) is a systemic autoimmune disease that affects multiple systems and organs of patients, especially the kidneys and the cardiovascular system. SLE is prone to relapse and has a high rate of disability and mortality [1,2]. However, there is currently no effective treatment for patients with SLE, which places a heavy burden on individuals and society. SLE is characterized by production of a large number of antibodies [3], which are expressed in the cell membrane, nucleus, and cells. At the same time, these antibodies bind to key proteins in the circulating system and produce specific changes, which is conducive to the diagnosis of SLE. Clinical studies have shown that the diagnosis of SLE is based on the patient’s symptoms and physical examination results, such as thrombocytopenia, but it can still be missed. Therefore, in-depth studies on the pathogenesis of SLE and the search for key targets and specific markers are of great significance for the treatment and early screening of SLE.
With the improvement of high-throughput sequencing platforms, microarray chip technology is increasingly being used to analyze differential gene expression to explore and identify potentially promising biomarkers and provide a new approach for genome-level disease diagnosis and prognosis. Clinical studies have found that the base mutations and abnormal expression of TNFSF4, NCF1-339, CXORF21, IF127, and other genes are closely related to the pathophysiological process of SLE [4,5]. Zhao et al found that the methylation level of the IFI44L promoter could be used as a biomarker for the diagnosis of SLE. Changes in the expression of immune markers, including Tyrobp, C1qb, LapTM5, CTSS, and PTPRC, are closely associated with the disease pattern of lupus nephritis tubular adenitis [6]. In the Chinese population, the frequency of single-nucleotide polymorphism mutations in SCUBE3 is reduced in CD3+ T cells and B cells in patients with SLE [7]. Furthermore, it has been found in experimental animal models that cGAS is activated in TREX1 mutant mouse models [8], leading to lupus-like autoimmune diseases. Therefore, it is necessary to identify accurate molecular targets and biomarkers in the diagnosis and treatment of SLE.
Autophagy is a common biological phenomenon in eukaryotic cells. Autophagy is an important metabolic process that degrades proteins and organelles in the cytoplasm into amino acids and fatty acids, thus generating energy and recovering “metabolic wastes” [9]. Conditional knockdown of autophagy-related genes (ARGs) in mice reduced the levels of inflammatory cytokines and autoreactive immune cells, thereby alleviating autoimmune disease model symptoms. Inhibition of autophagy promotes the production of inflammatory cytokines, leading to an increase in the incidence of various autoimmune diseases [10]. Currently, studies have discovered more than 30 genes closely related to autophagy [11,12]. However, the role of ARGs in SLE has not been fully elucidated.
A large number of epigenetic incidents, including non-coding RNA regulation, chromatin remodeling, histone modification, and DNA methylation, have been reported to contribute to the pathophysiologic process of autoimmune diseases [13]. DNA methylation, a well-known epigenetic factor and the most researched epigenetic mechanism, is reported to be related to mRNA and miRNA expression regulation [14]. Recently, numerous studies have indicated that abnormal DNA methylation in gene promoter regions is involved in SLE pathogenesis [15–17].
In the present study, we used gene expression microarray data from the Gene Expression Omnibus (GEO) database (https://www.ncbi.nlm.nih.gov/geo/) and performed mRNA profiling. Bioinformatic analysis was used to screen hub genes between SLE and healthy samples through weighted gene co-expression network analysis (WGCNA). ARGs were overlapped with the hub genes identified from WGCNA, and then feature ARGs were acquired. Next, based on a series of feature ARGs, 3 genes (S100A8, MyD88, NCR3) with high diagnostic efficacy for SLE were identified though LASSO regression analysis. At the same time, we explored the methylation levels of these 3 genes using a methylation array. Finally, we verified the expressions of 3 genes in the peripheral blood mononuclear cells (PBMCs) of SLE patients and controls by reverse transcription polymerase chain reaction (RT-PCR), and evaluated the DNA methylation level in these genes promoter regions by methylation-specific PCR (MSP). These identified feature ARGs and differential DNA methylation positions are potential biomarkers and pathological mechanisms of SLE that warrant future investigation.
Material and Methods
MICROARRAY DATA ACQUISITION AND PROCESSING:
The expression profile chip data were downloaded from the GEO; whole-genome transcription and DNA methylation analysis of PBMCs identified aberrant gene regulation pathways in SLE. By setting “systemic lupus erythematosus” as the search keyword, we obtained the GSE81622 dataset, which is available on the GPL10558 platform (Illumina HumanHT-12 V4.0 expressed bead). This dataset had 55 PBMCs samples, including 30 SLE samples and 25 controls. The detailed clinical information of the samples in the dataset is shown in Table 1. The analysis procedure of this study is shown in Supplementary Figure 1.
DIFFERENTIALLY EXPRESSED GENES (DEGS) ANALYSIS:
Limma package in R identified the DEGs based on the comparisons between the healthy controls and SLE samples, and the good normalization of the expression matrix was acquired as well. The threshold values were |log2 FC| >1.2 and
CONSTRUCTION OF WGCNA:
The GSE81622 dataset and sample clinical data were downloaded from the GEO database. All genes in the normal and SLE samples were sequenced according to standard deviation (SD) values, and the top 25% of genes were selected for WGCNA analysis [18]. We constructed a weighted adjacency matrix to clarify the correlation between genes through correlation forces (soft threshold parameters). Then, the adjacency relationship of genes was transformed into a topological overlap matrix (TOM) to measure the network connectivity of genes. TOM adds adjacency genes to obtain the network gene ratio and calculates the corresponding dissimilarity. Genes with similar expression profiles were classified by average linkage hierarchical clustering based on the TOM dissimilarity measure and were in the same module. Gene modules are represented by branches and different colors in the cluster tree. The correlation between gene modules and phenotypes was calculated, and modules related to clinical characteristics were identified. A visual gene network was constructed for 400 characteristic genes.
IDENTIFICATION OF SIGNIFICANT MODULES AND ENRICHED GO AND KEGG PATHWAY ANALYSIS:
First, the correlation between module eigengenes (MES) and clinical features was calculated to determine the relevant modules. In principal component analysis, gene significance (GS) is the log10 conversion of the P value in linear regression between gene expression and clinical information (GS=LG P). MES were taken as the principal components of each gene module, and the expression patterns of all genes were summarized into a single characteristic expression profile within a specific module. The correlation between MES and disease state (SLE vs control) was then calculated to determine the relevant modules. Leveraging online annotation, visualization, and integrated discovery databases (David; https://david.ncifcrf.gov/summary.jsp) [19,20], the biological progress (BP), cell components (CC), molecular function (MF), and the Kyoto Encyclopedia Gene and Genome (KEGG) pathways can be analyzed, furthering the understanding of gene function in the key module. The R package “VennDiagram” plots a Venn diagram by overlapping the key modules with the genes in the ARGs. Statistical significance was set at P<0.05. Gene annotation information on the platform was used to transform the probes into homologous gene symbols. Next, a total of 799 ARGs were obtained by searching the Human Autophagy Database (http://autophagy.lu/). The recursive feature elimination algorithm can improve the classification accuracy and select risk genes from feature ARGs [21,22].
EVALUATION OF HUB GENES FROM ARGS:
The R package “corrplot” was used to conduct the correlation analysis and visualization of 18 hub genes. Box plots of the gene expression differences between controls and SLE were drawn using the “ggplot2” package.
CONSTRUCTION OF A DIAGNOSTIC GENES MODEL:
Least absolute shrinkage operator (LASSO) logistic regression was used for feature selection to obtain diagnostic markers of SLE. The LASSO analysis was done using the “glmnet” software package. First, the lambda value was determined by the least likelihood deviation. When lambda values are determined, the coefficient-lambda curve showed the genes that meet the criteria. According to the partial likelihood deviation and lambda value, the risk coefficients of each gene after the deletion of some genes with over-fitting risk were calculated. The LASSO risk was calculated using the following formula:
The residual genes were used to construct a prognosis prediction model for SLE. Based on the median value, a corresponding risk score was calculated. Based on this score, the samples were divided into low-risk and high-risk groups. Subsequently, multivariate Cox proportional risk regression analysis was performed to further select the genes, and the results were visualized using the “forestplot” software package. Finally, receiver operating characteristics (ROC) were mapped through the “PROC” software package to evaluate the sensitivity and specificity of the predictive model.
METHYLATION ANALYSIS OF HUB GENES:
The DNA methylation profile dataset (GSE96879) was downloaded from the GEO database to observe the methylation levels of hub genes. The GSE96879 dataset consisted of 33 controls and 57 samples derived from PBMCs. At the CpG site of each gene, differences in DNA methylation between SLE and control samples (reported as changes in beta values [Δβ]) were analyzed using linear regression. The β value is the ratio of the methylated probe strength to the total probe strength (the sum of the methylated and unmethylated probe strengths), ranging from 0 to 1 [23]. The methylation levels were analyzed using the “minfi” and “impute” packages in R.
DIFFERENTIALLY METHYLATED GENES (DMGS) ANALYSIS:
GEO2R was used to calculate the DMPs based on comparisons between the controls and SLE patients. The threshold values were |log2 FC| (Δβ) >0.05 and
GENE SET ENRICHMENT ANALYSIS (GSEA) OF HUB GENES:
According to the median expression level of each hub gene, all samples were divided into 2 groups: high expression and low expression. The enrichment results of hub genes were conducted using the GSEA software [24,25]. The cutoff criteria were nominal P<0.05, and false discovery rate <25%.
CLINICAL INFORMATION OF PARTICIPANTS:
The present study was reviewed and approved by the Ethics Committee of Yunnan Provincial Hospital of Traditional Chinese Medicine of Yunnan University of Chinese Medicine. All participants provided written informed consent. A total of 38 individuals with SLE (aged 17 years and above, average age: 37.1±8.3 years) were recruited from the Rheumatology and Immunology Division of Yunnan Provincial Hospital of Traditional Chinese Medicine (Yunnan University of Chinese Medicine) between December 2015 and February 2020. All patients with SLE fulfilled the American College of Rheumatology classification criteria for SLE [26]. Disease activity was assessed in SLE patients using the Systemic Lupus Erythematosus Disease Activity Index (SLEDAI), where a SLEDAI score of >4 was considered “active” and a SLEDAI score of <4 was “inactive.” The normal control group consisted of 44 healthy donors (aged 40.2±8.3 years) with no history of cancer, cardiovascular diseases, autoimmune diseases, known infectious diseases, or immunosuppressive therapy. The control group was matched by age and sex to the patient group. The baseline characteristics of all the subjects are listed in Table 2.
THE PROCEDURE OF RT-PCR:
The samples in the GSE81622 and GSE96879 datasets were both from PBMCs. To verify the results of bioinformatic analysis, we collected the PBMCs of volunteers by density-gradient centrifugation with Ficoll-Paque Premium (Sigma, St Louis, USA), according to the manufacturer’s instructions. Total RNA was extracted from PBMCs using TRIzol (Thermo Fisher Scientific, MA, USA) and converted to complementary DNA using the HiScript® II First Strand cDNA Synthesis Kit (Vazyme, Nanjing, China). The concentration and quality of total RNA were measured and evaluated using a Nanodrop Spectrophotometer. RT-PCR was conducted using ChamQ™ Universal SYBR® qPCR Master Mix (Vazyme, Nanjing, China). Amplification was performed according to the following procedure: initial denaturation at 95°C for 30 s, followed by 30 cycles of amplification (95°C for 10 s, 60°C for 30 s). GAPDH served as an internal control. Relative quantification of expression was performed compared with the internal standard using the 2−ΔΔCT method. All results are representative of at least 3 independent experiments. The primer sequences of the hub genes are shown in Table 3.
METHYLATION-SPECIFIC PCR (MSP):
The prediction of CpG island status in the promoter regions of S100A8, MyD88, and NCR3 was conducted using MethPrimer (http://www.urogene.org/). Genomic DNA extraction kits (Vazyme, Nanjing, China) were used to isolate genomic DNA, and agarose gel electrophoresis was performed to determine the integrity of the DNA. In the present study, the isolated DNA specimen was bisulfite-converted using the EpiArt™ DNA Methylation Bisulfite Kit (Vazyme, Nanjing, China). Subsequently, we amplified the samples according to the manufacturer’s instructions, and the primer sequences for MSP amplification are shown in Table 4.
STATISTICS ANALYSIS:
Data are expressed as the mean±SD. One-way analysis of variance was used for comparison between the 2 groups. In the RT-PCR experiment, expression graphs and 2−ΔΔCT values were calculated using GraphPad Prism (Version 8.0.1), and a
Results
EXPRESSION VALUE ANALYSIS OF MICROARRAY DATA:
The GSE81622 dataset was downloaded from the GEO database, which included 55 PBMCs samples. There was a total of 47 323 probes on the GSE81622 dataset. Using the information from the annotated files in the platform, the probes were converted into homologous gene symbols, and probes that matched multiple genes were removed. The median of the genes matched with multiple probes was used as the final expression value. After analysis of GSE81622, 382 DEGs were identified, of which 126 upregulated and 256 downregulated. The heat map and volcano plot of the DEGs are presented in Supplementary Figure 2 and Supplementary Table 1. The first 25% of the genes were selected for the construction of the WGCNA co-expression network.
WGCNA AND KEY MODULE IDENTIFICATION:
The WGCNA package in R software (Version 3.6.2) was used to construct the weighted gene co-expression network and identified biologically significant modules. After the outlier sample GSM2159873 was deleted (Supplementary Figure 3), the FashCluster function of the WGCNA packet was used for cluster analysis of 8674 genes (Supplementary Table 2). When the soft threshold β value was 9 (Figure 1A, 1B), the connectivity between genes met the scale-free network distribution to construct the WGCNA network. The results showed that there was a total of 27 highly correlated gene modules (Figure 1C).
CORRELATION BETWEEN MODULES AND IDENTIFICATION OF KEY MODULES:
The interaction between the 27 co-expression modules was analyzed, and a network heat map analysis was performed for all genes (Figure 1D). The results showed that each module was verified independently of each other, which indicated that each module had a high degree of independence and that gene expression was relatively independent in each module. In addition, the characteristic genes were calculated and clustered according to their correlation to explore the co-expression similarity of all modules (Figure 1E). We found that the 27 modules were mainly divided into 2 clusters, and the above results were also proved by the heat map drawn according to the adjacency relationship (Figure 1F). The red module was negatively correlated with disease status (−0.86, 2e–16), suggesting that it may play a protective role in SLE. In addition, compared with the other modules, it was the one most associated with SLE disease status. An illustration of the correlation between module membership and GS in the red module is shown in Figure 2.
FUNCTIONAL ENRICHMENT ANALYSIS OF GENES IN MODULES OF INTEREST:
Since the red module was highly correlated with the pathophysiological processes of SLE, GO and KEGG enrichment analyses were performed to gain further biological insight into the genes in the building blocks. GO analysis identified 107 BP, 22 CC, and 35 MF pathways. KEGG analysis identified 20 pathways (Supplementary Table 3). The top 10 GO and KEGG pathways are shown separately. From the chart, the greatest correlated BP GO terms indicated that the genes were mainly related to the regulation of immune response, innate immune response, inflammatory response, and apoptotic process pathways (Figure 3A). The CC terms indicated that the genes were related to the plasma membrane, integral component of plasma membrane, and lysosome (Figure 3B). The MF terms emphasized protein binding, transmembrane signaling receptor activity, receptor activity, and carbohydrate binding (Figure 3C). KEGG highlighted the correlation between natural killer cell-mediated cytotoxicity, tuberculosis, and lysosomes (Figure 3D). These immune-related genes and immune-related pathway enrichment results show the feasibility of exploring novel immune markers.
HUB GENE IDENTIFICATION:
A total of 55 genes that were highly connected to the red module (MM >0.8, GS >0.5) were identified (Supplementary Table 4). ARGs were extracted from the Human Autophagy Database and the GO_AUTOPHAGY gene set in the Molecular Signatures Database v7.1 website (https://www.gsea-msigdb.org/gsea/msigdb/index.jsp), and grouped together into an ARG gene set. The Venn diagram showed that 18 genes in the red module overlapped with the ARGs gene set: PPP2R2B, DRAMe1, TRAPPC2, IFNGR1, S1PR3, TLR4, PLEKHF1, NPC1, TLR5, BNIP3, S100A8, MyD88, FoxO1, S100A9, NOD2, SH3GLB1, SESN1, and NCR3 (Figure 4A, Supplementary Table 5). The expression of these 18 genes in GSE81622 is shown in Figure 4C.
CONSTRUCTION OF DIAGNOSTIC RISK MODEL:
Figure 4B shows the correlation matrix analysis of 18 genes, and some autophagy genes showed a strong correlation. LASSO analysis was used to solve the multicollinearity problem in the regression analysis. To further reduce the feature ARGs and identify effective candidate diagnostic biomarkers, a LASSO model containing 18 genes was established based on the lambda value (Figure 5A, 5B). Multivariate logistic regression analysis was used to determine the basic phenotypic information of independent candidate diagnostic biomarkers (age, sex, and disease status), and 4 genes with the highest efficacy were obtained: S100A8, MyD88, NCR3, and NOD2 (Figure 5C, 5D). These 4 genes showed good diagnostic value for SLE. The area under the curve (AUC) was 0.939 (95% CI 0.840 – −0.970), 0.862 (95% CI 0.742 – −0.938), 0.952 (95% CI 0.864 – −0.980), and 0.697 (95% CI 0.5427 – −0.8167), respectively (Figure 6). Second, to improve the diagnostic efficiency of biomarkers, the gene expression of each gene was multiplied by its corresponding coefficient, and a new diagnostic risk score was obtained through multivariate logistic regression analysis. The diagnostic score was as follows: optimal diagnostic risk model=(0.705* S100A8 expression level)+(2.812* MyD88 expression level)+(− −2.96×NCR3 expression level)+(0×NOD2 expression level). The differentiation ability of the diagnostic score was assessed by calculating the area under the ROC curve. An AUC of >0.7 suggested a high diagnostic value (Figure 6A); thus, NOD2 was excluded.
METHYLATION ANALYSIS OF THE HUB GENES:
GSE96879 dataset included 57 SLE patients and 33 healthy controls, all the samples from PBMCs. The heat map of the top 20 DMPs in the GSE96879 dataset is shown in the Figure 6B and Supplementary Table 6. The data were passed through quality control indicators and used for methylation analysis. First, the expression levels of S100A8, MyD88, and NCR3 were detected in controls and SLE patients. The results showed that, compared with the control group, the expression levels of S100A8 and MyD88 were upregulated, while the expression levels of NCR3 were downregulated (Figure 4C). Second, we investigated the relationship between the methylation levels of S100A8, MyD88, and NCR3 genes and susceptibility to SLE. After analysis, the highly significant methylation sites of these 3 genes were cg01431057 (P=0.0057) and cg24898863 (P=0.0016) (Figure 6C), cg15107884 (P=0.0095) (Figure 6D), and cg03686228 (P=0.0038), and cg27490128 (P=0.00053) (Figure 6E), respectively. Through analysis of these 3 genes, we found that S100A8 was hypomethylated and upregulated, while NCR3 was hypermethylated and downregulated.
GSEA ANALYSIS:
To identify the potential functions of the hub genes, GSEA was conducted to identify KEGG pathways enriched in the samples in which S100A8 and MyD88 were highly expressed and NCR3 was expressed at low levels. The gene sets “peroxisome” and “starch and sucrose metabolism” were enriched in SLE samples with high S100A8 expression (Figure 7A), the gene set “snare interactions in vesicular transport” was enriched with high MyD88 expression (Figure 7B), and the gene set “starch and sucrose metabolism” was enriched with low NCR3 expression (Figure 7C).
QRT-PCR VALIDATION OF 3 HUB GENES:
The demographic data of patients with SLE and healthy controls are presented in Table 2. The mean ages were 37.9 and 36.4 years for patients with high and low disease activity, respectively. To further verify the bioinformatics analysis results, we examined the expression profiles of these 3 genes in PBMCs samples from 18 active SLE patients, 20 inactive SLE patients, and 44 healthy controls by RT-PCR. As shown in Figure 8A–8C, the gene expression levels of MyD88 and S100A8 were higher, while NCR3 was lower, in active and inactive SLE patients than in those of healthy controls.
VALIDATION OF THE DNA METHYLATION OF HUB GENE:
Methylation of gene promoters regulates the expression profile of genes. We formulated the following screening criteria to select appropriate methylated positions for subsequent experiment: (1) the methylated position was located in the promoter region, (2) the methylation level of the position was significantly correlated with gene expression, and (3) the CpG dinucleotide content was enriched in the 300-bp upstream and downstream regions around the methylated position.
Based on the above definitions, we wanted to know which of the 5 DMPs (cg01431057, cg24898863, cg15107884, cg03686228, and cg27490128) were located in the promoter of gene. The information and location of these 5 DMPs are exhibited in Supplementary Table 7 and Supplementary Figure 4. From the online website retrieve (https://www.ensembl.org/index.html), we found that only cg24898863 and cg27490128 were located in the promoter region of S100A8 and NCR3, respectively. Thus, these 2 DMPs corresponding to 2 unique genes (cg24898863-S100A8 and cg27490128-NCR3) were selected for further study.
First, an analysis was performed on the methylation profile of these 2 genes in 2 groups, and we found that NCR3 and S100A8 were hypermethylated and hypomethylated in the SLE group (Figure 9A, 9B).
Next, we conducted a correlation analysis between DNA methylation and gene expression in the same samples, and we found that NCR3 and S100A8 methylation were closely associated with their respective expressions (Figure 9C, 9D). The value of |r| in the correlation between NCR3 methylation and relative expression was higher than 3, indicating that the correlation was strong.
Discussion
SLE is a chronic autoimmune disease with complicated clinical manifestations that lead to multiple systemic impairments. At present, there is no effective radical therapy for SLE, and patients require long-term or even lifelong medication, affecting their quality of life. According to statistics, 150 cases of SLE occur in 100 000 people and 15% of people with SLE for 5 years have kidney failure or death [27]. The development of SLE is jointly influenced by various factors, such as genes, environment, epigenetics, and hormones. However, the precise pathogenesis of SLE remains unclear. Therefore, in-depth research on the pathogenesis, especially screening effective biomarkers, and early diagnosis and treatment, will improve the quality of life of patients.
In the present study, the expression array dataset GSE81622 was used to identify 3 key ARGs (S100A8, MyD88, and NCR3) for constructing a diagnostic gene model for SLE. The DNA methylation profiling dataset GSE96879 was analyzed to detect the differential methylation level in these 3 gene promoter regions, and the experiment validated the ARG expression and methylation levels, as well as the association between them. To the best of our knowledge, this is the first study to report that autophagy-associated genes can serve as diagnostic models for SLE and to explore the mechanisms of ARGs involved in DNA methylation.
Autophagy is an essential degradation pathway through the lysosome, which produces macromolecular precursors and the energy required by cells and participates in the basic turnover of CC [28]. Interestingly, autophagy plays an opposite and environment-dependent role in many diseases. For example, after starvation-induced autophagy occurs, organelles and proteins in the lysosome are captured and broken down. Autophagy plays a role in protecting organisms from a variety of diseases, especially heart disease, aging, infection, and neurodegeneration [29]. A growing number of studies have indicated that autophagy, which is involved in numerous immune processes such as the removal of intracellular bacteria, cytokine production, autoantigen presentation, and survival of lymphocytes, plays a key role in innate and adaptive immune responses. Therefore, the exploration of autophagy in the pathogenesis of SLE may reveal a new therapeutic approach and provide novel diagnostic markers. With the help of various array data in many public databases, especially GEO databases, and bioinformatics analysis, clinical biomarkers and potential therapeutic targets can be explored and identified [30]. In the present study, the expression profiles and corresponding clinical information of SLE patients were downloaded from GEO databases, and 3 ARGs (S100A8, MyD88, and NCR3) with high diagnostic value in SLE were identified by LASSO.
Myeloid differentiation factor 88 (MyD88), located on chromosome 3, is a key junction molecule in the Toll-like receptor signaling pathway, which plays an important role in upstream information transmission and disease development. Several studies have investigated the role of MyD88 in SLE and the relationship between them; however, the findings were not consistent. Nakano et al reported that there was no significant difference in MyD88 mRNA expression between Chinese SLE patients with B lymphocytes and controls [31]. In contrast, Chen et al found that upregulation of MyD88 gene expression was correlated with higher SLE activity [32]. Furthermore, the overexpression of molecules in MyD88-dependent signaling aggravated the disease [33].
The pro-inflammatory calcium-binding protein, S100A8, belongs to the family of S100 proteins and is secreted mainly by activated polymorphonuclear neutrophils and monocytes [34]. When S100A8 is released, it serves as a damage-associated molecular pattern molecule and combines with various receptors to exert pro-inflammatory effects, such as monocyte activation, cytokine production amplification, and migration of myeloid-derived suppressor cells. In addition, it is a ligand for advanced glycation end-products (RAGE) receptors and TLR4 [35,36]. Several studies have demonstrated that S100A8 is increased in the serum of patients with several autoimmune inflammatory disorders, such as psoriatic arthritis, inflammatory bowel disease, rheumatoid arthritis, infection, and SLE [37–41], suggesting that this factor plays an important role in the pathogenesis of SLE [42].
Natural killer (NK) cells belong to the innate immune system and are a series of lymphocytes that have a protective effect against infection. The function of NK cells is regulated by a precise balance of signals transmitted by several surface receptors that have inhibitory or activating functions. NCR3, an important part of the activating receptors, acts as a natural cytotoxic receptor [43]. Puxeddu et al reported that there was no difference in the expression of NCR3 between controls and SLE patients, and there was no difference between active and inactive SLE patients. However, NCR3 expression was decreased in pulmonary arterial hypertension patients and was lower in patients with interstitial lung disease [44]. We performed RT-PCR to validate the mRNA expression of the 3 genes; however, the results were not in line with previous studies. For example, the gene expression of NCR3 was higher in PBMCs from patients with active SLE. We speculated that the difference between our study and other studies might be attributed to the different races and cell types.
Recently, a growing number of studies on epigenetic regulation have suggested that gene methylation is an important mechanism for disease onset and progression. CpG islands are defined as stretches of DNA 500–1500 bp long with a CG base and GC base ratio of more than 0.6. CpG islands are usually located in the gene promoter region and contain the 5′ end of the transcript. From an evolutionary standpoint, CpG islands have been recognized from a sequence of bases to be functional and important players in the definition and regulation of promoter regions of vertebrates. It is common knowledge that CpG is closely associated with abnormal DNA methylation and is a factor in defining active or potentially active promoter regions [45]. On one hand, the methylation level can regulate the gene expression. The expression levels of genes may decrease when promoter hypermethylation occurs or gene expression may increase, while its promoter is hypomethylated [46]. On the other hand, CpG dinucleotides are hypomethylated in a special part of the genome, resulting in loss of imprinting and reactivation of transposable elements, and finally, chromosome instability [47]. Previous studies have indicated that progressive DNA methylation is accepted as a functional regulator in the pathogenesis of SLE. Zhao et al reported a reduction in global genomic DNA methylation. In addition, in patients with SLE, specific autoimmune-related genes such as ITGAL, TNFSF7, PRF1, and CD4+ T cells were hypomethylated in their promoters [48,49]. Furthermore, multiple genome-wide DNA methylation studies have shown that there are many differentially methylated genes that are hypomethylated in SLE patients [50,51]. Based on these previous studies, we decided to explore whether abnormal DNA methylation in PBMCs could be beneficial for SLE diagnosis. The results of the bioinformatic analysis of GSE96879 showed that S100A8, MyD88, and NCR3 possessed 5 abnormal DNA methylation positions, 2 of which (cg24898863 and cg27490128) are located in the promoter region of S100A8 and NCR3, respectively. Interestingly, we found a correlation between DNA methylation and gene expression in these 2 genes. It was previously suggested that the methylation levels of CpG islands are reduced in the MyD88 promoter region in CD4+ T cells; however, the methylation levels of S100A8 and NCR3 in relation to SLE have not yet been studied.
In addition, GSEA results showed that the abnormal expressions of S100A8, MyD88, and NCR3 are involved in metabolic pathways, such as peroxisome, starch, and sucrose metabolism, which are implicated in the inflammatory response, innate immune response, and chemokine signaling pathway associated with SLE. Since S100A8 and NCR3 are regarded as the key functional factors in SLE, we speculated that abnormal methylation levels of cg24898863 and cg27490128 in S100A8 and NCR3 promoter regions, respectively, are important genetic predictors of SLE.
There were several limitations to the present study. First, the sample size in the GSE81622 dataset was small, and only 1 dataset was analyzed; thus, there may be some deviation in the final results. Second, we only observed this phenomenon in PBMCs. There are various cell types in PBMCs, and in future studies, various experimental methods should be used to verify the results. Third, the sample size in our study was small, and the patients were all from our hospital, with no multicenter studies conducted. Finally, autoantibodies for the diagnosis of SLE is attractive to many medical scientists; unfortunately, we did not examine the autoantibodies in the present study. In the future research, we plan to focus on the association between the differentially expressed genes (DEGs) and the most commonly studied autoantibodies for the diagnosis of SLE. Thus, the validity of the present study should be further tested in prospective cohorts.
Conclusions
The present results showed that S100A8, MyD88, and NCR3 can function as diagnostic markers in SLE. In addition, abnormal DNA methylation levels in the promoter regions of S100A8 and NCR3 were found to be involved in the pathological process of SLE, which is beneficial in understanding the molecular mechanisms from an epigenetic perspective.
Figures
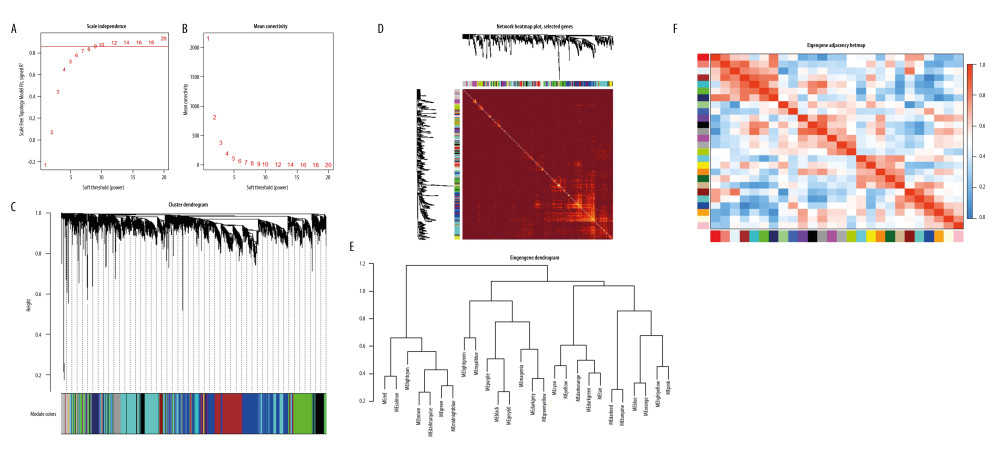 Figure 1. Construction of co-expression modules using the WGCNA package in R. (A) Analysis of the scale-free fit index for various soft-thresholding powers (β). The red line represents the merging threshold. (B) Analysis of the mean connectivity for various soft-thresholding powers. (C) The cluster dendrogram of genes in GSE81622. (D) Interaction relationship analysis of coexpressed genes. (E) Hierarchical clustering of module hub genes that summarize the modules yielded in the clustering analysis. (F) Heatmap plot of the adjacencies in the hub gene network.
 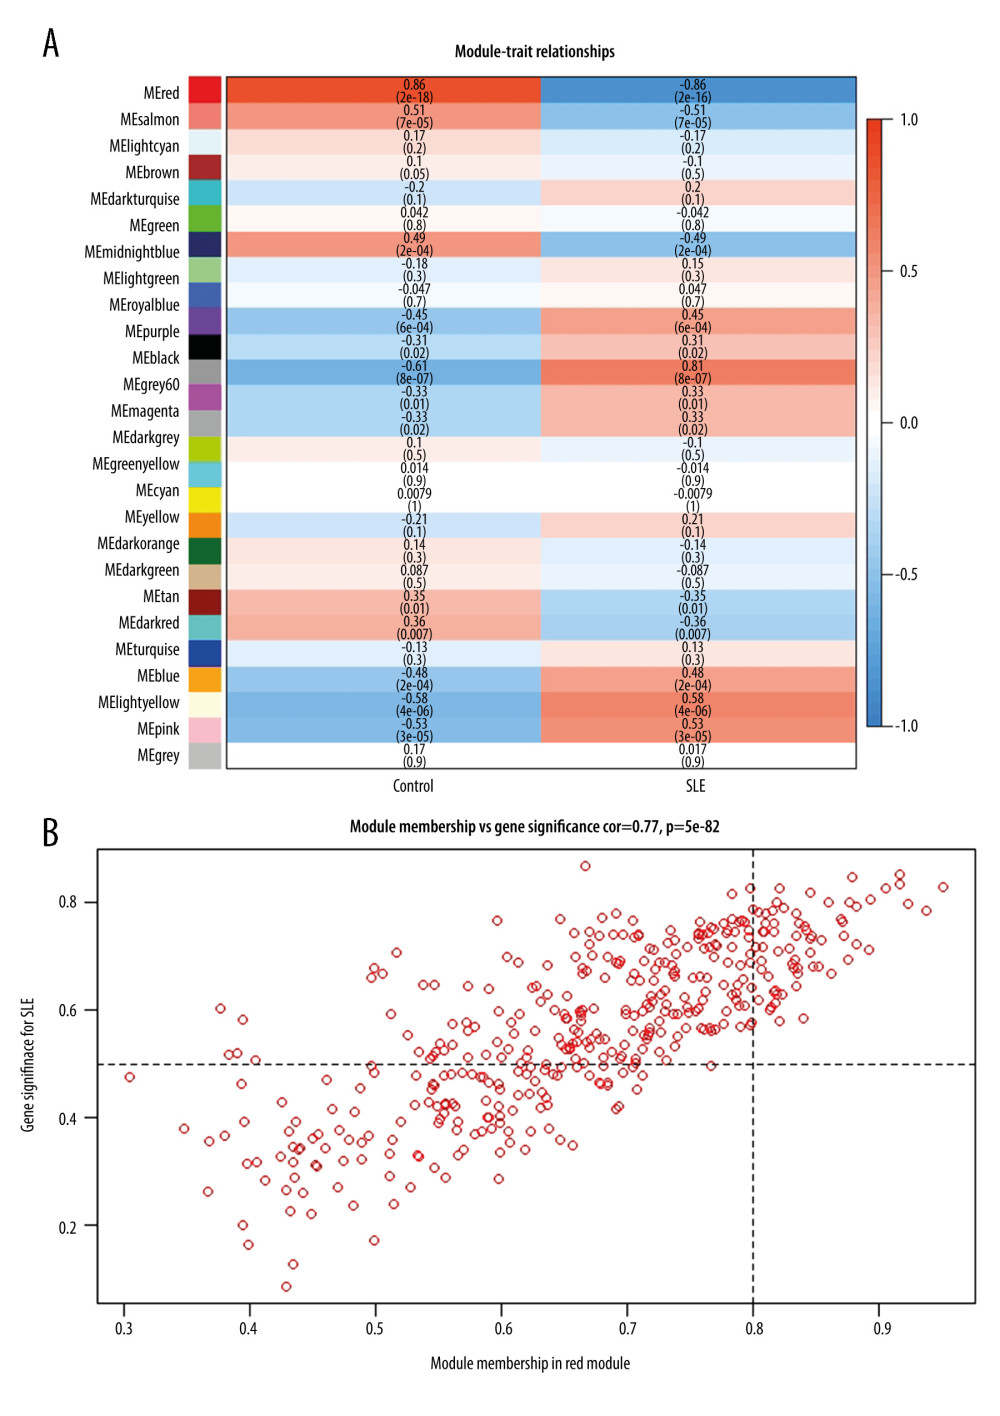 Figure 2. Hub genes in the network and red module. (A) Heatmap plot of the adjacencies in the hub gene network. (B) Scatter plot of module eigengenes in the red module.
 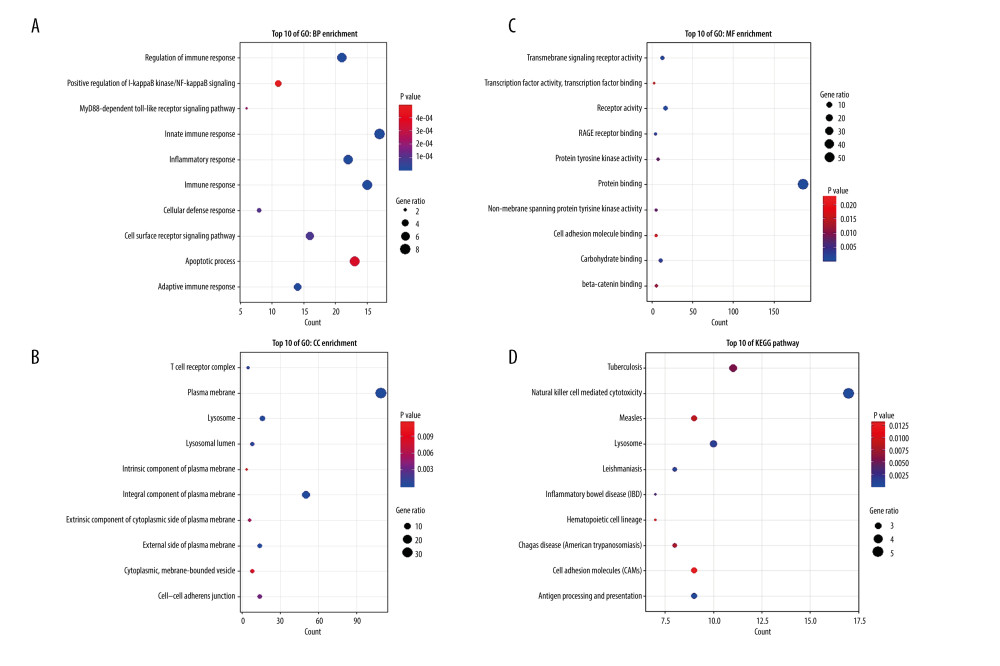 Figure 3. Top 10 GO analysis and KEGG pathway enrichment results for genes in red module. (A) The biological process group, (B) the cellular component group, (C) the molecular function group. (D) KEGG pathway enrichment result. The size of the bubble shows the gene ratios, while colors indicate the P value.
 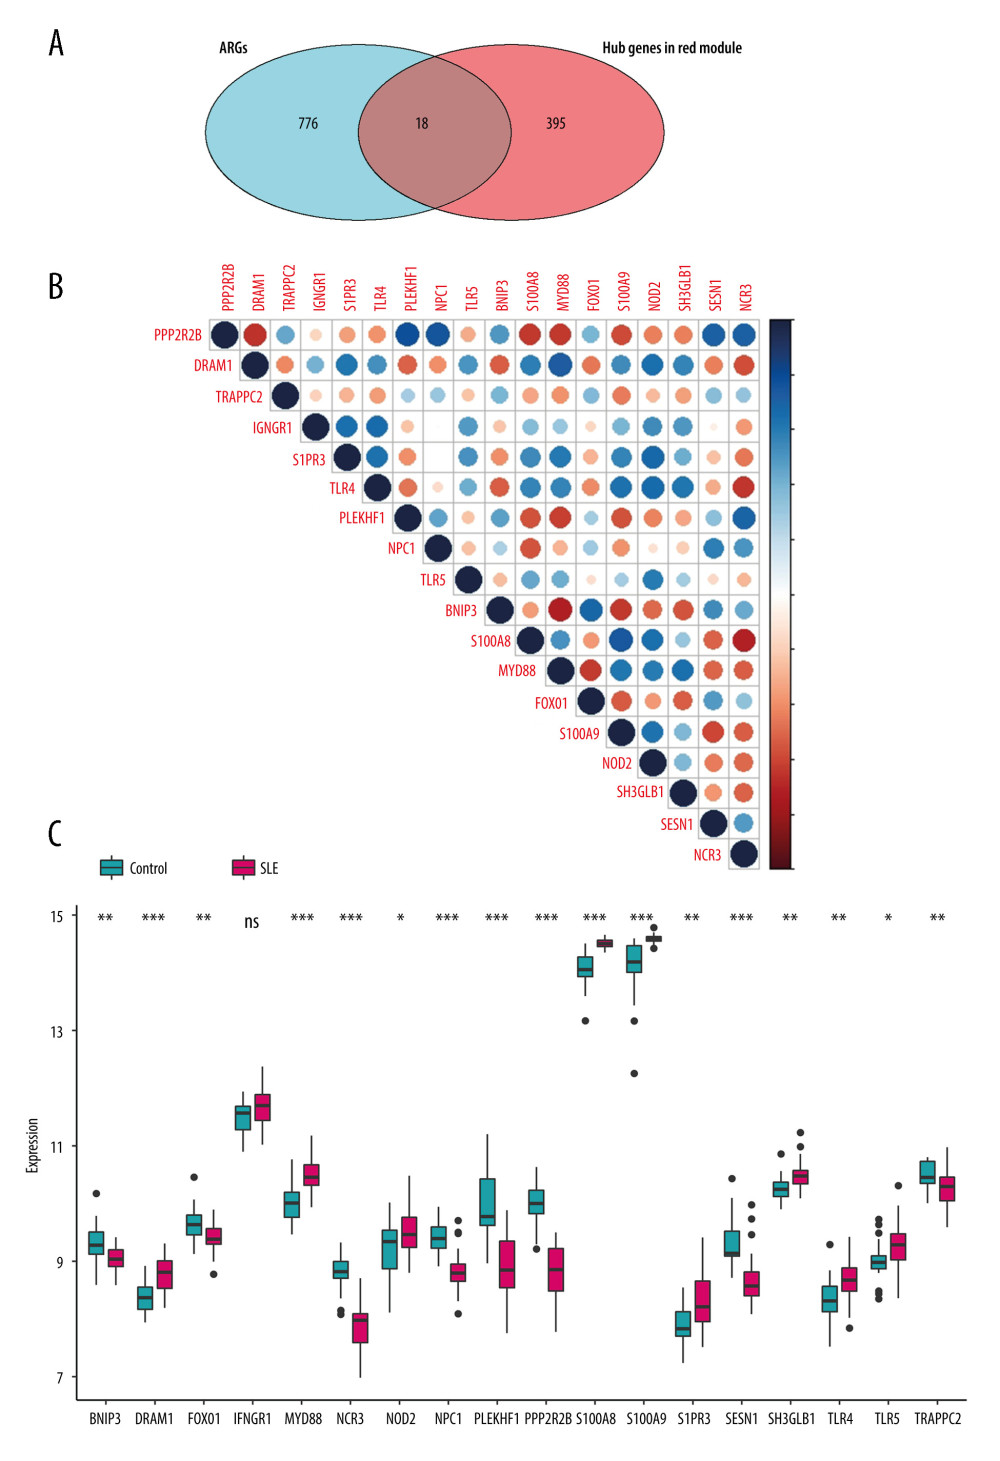 Figure 4. Identification of feature ARGs. (A) Selection of real hub genes in the ARGs and red modules. (B) Correlation heatmap shows gene co-expression patterns among ARGs. The colors represent correlations, and the size of the circles represent the size of the p values. (C) Boxplot shows the median expression level of each ARGs in both control and SLE samples, represented by red and green boxes, respectively.
 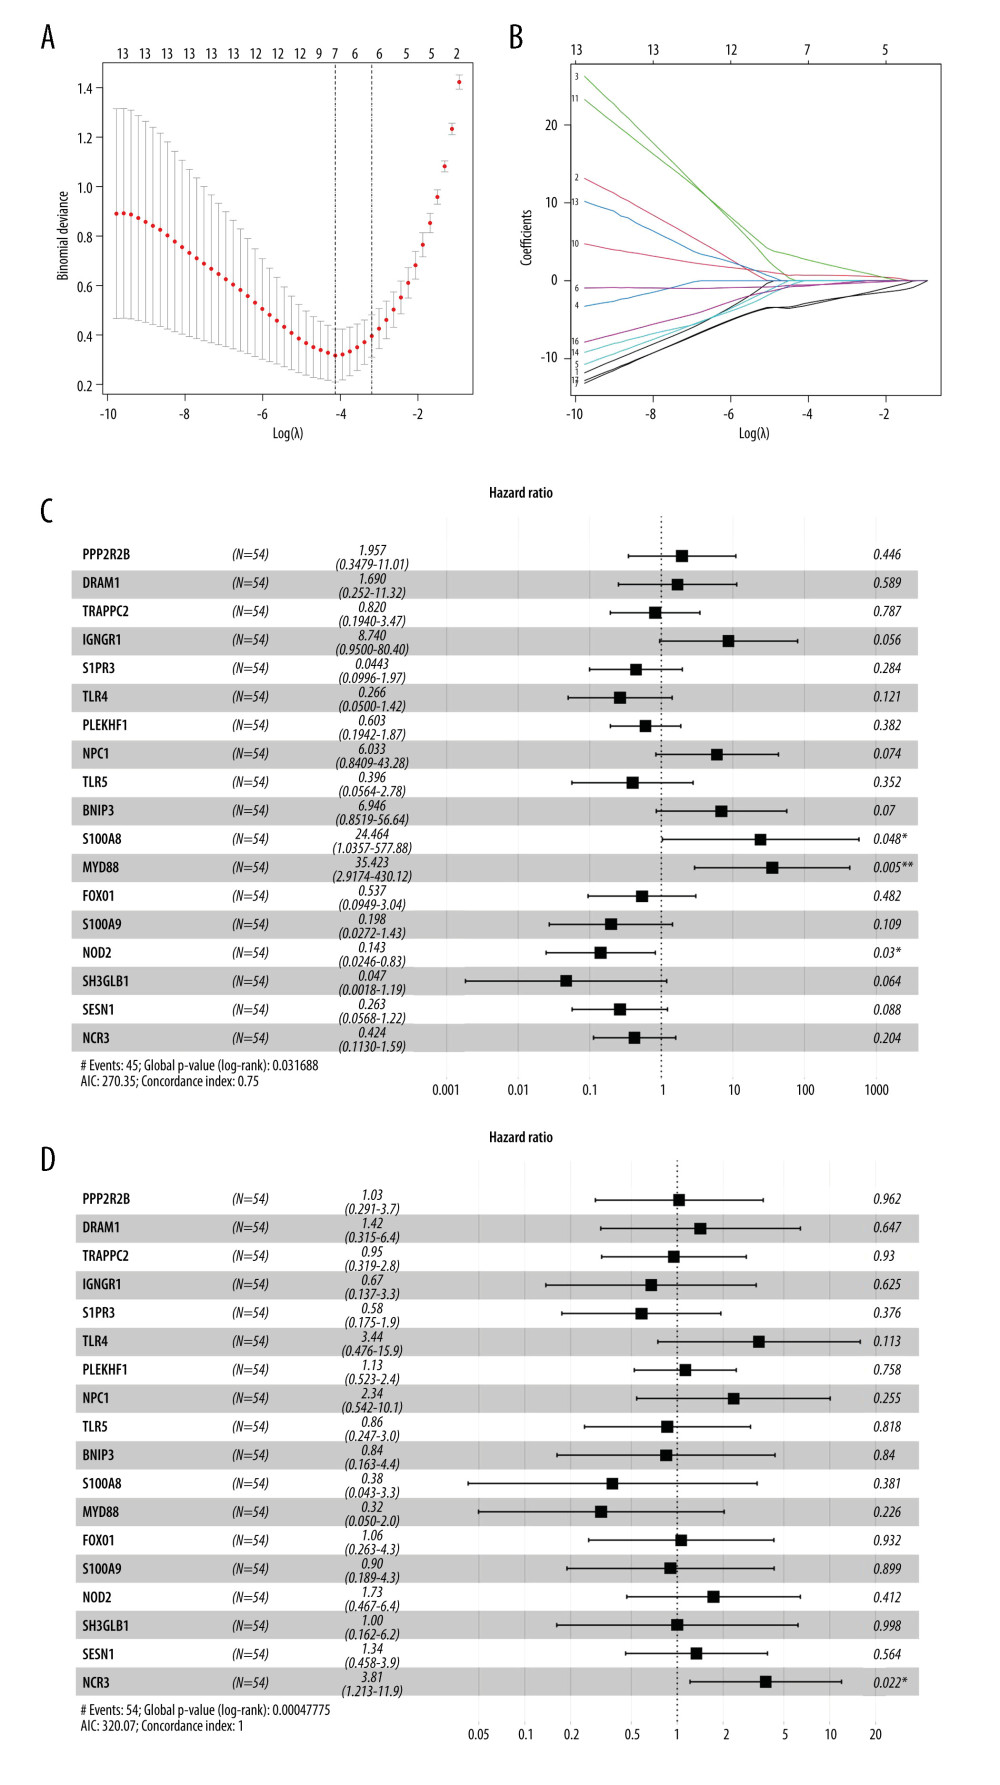 Figure 5. Selection of the differentially expressed ARGs that are related to disease. (A) The most appropriate log (Lambda) value in the LASSO model. (B) Log (Lambda) value of the 18 ARGs in least absolute shrinkage and selection operator (LASSO) model. (C) Multivariate Cox regression analysis shows the ARGs identified for risk signature construction by age, sex, and (D) disease state.
 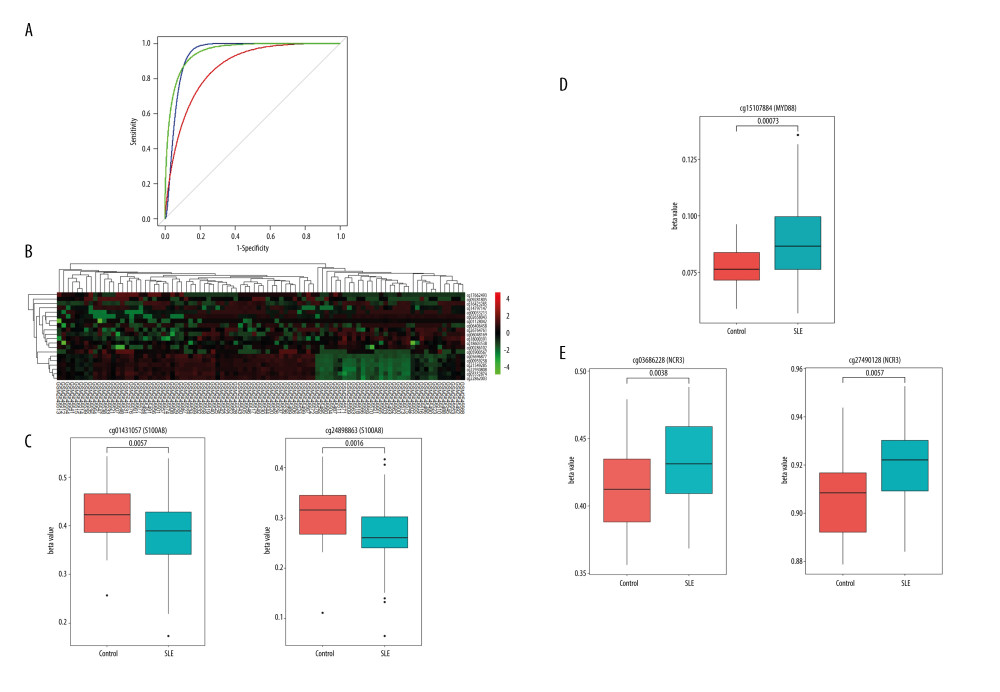 Figure 6. Methylation profiles of hub ARGs in GSE96879. (A) Receiver operating characteristic (ROC) curves for the diagnosis efficacy of ARGs. (B) The top 20 DMPs in GSE96879 dataset as shown in heatmap. The beta value of (C) S1008A, (D) Myd88, and (E) NCR3 were exhibited from GSE96879. Beta value indicated methylation level.
 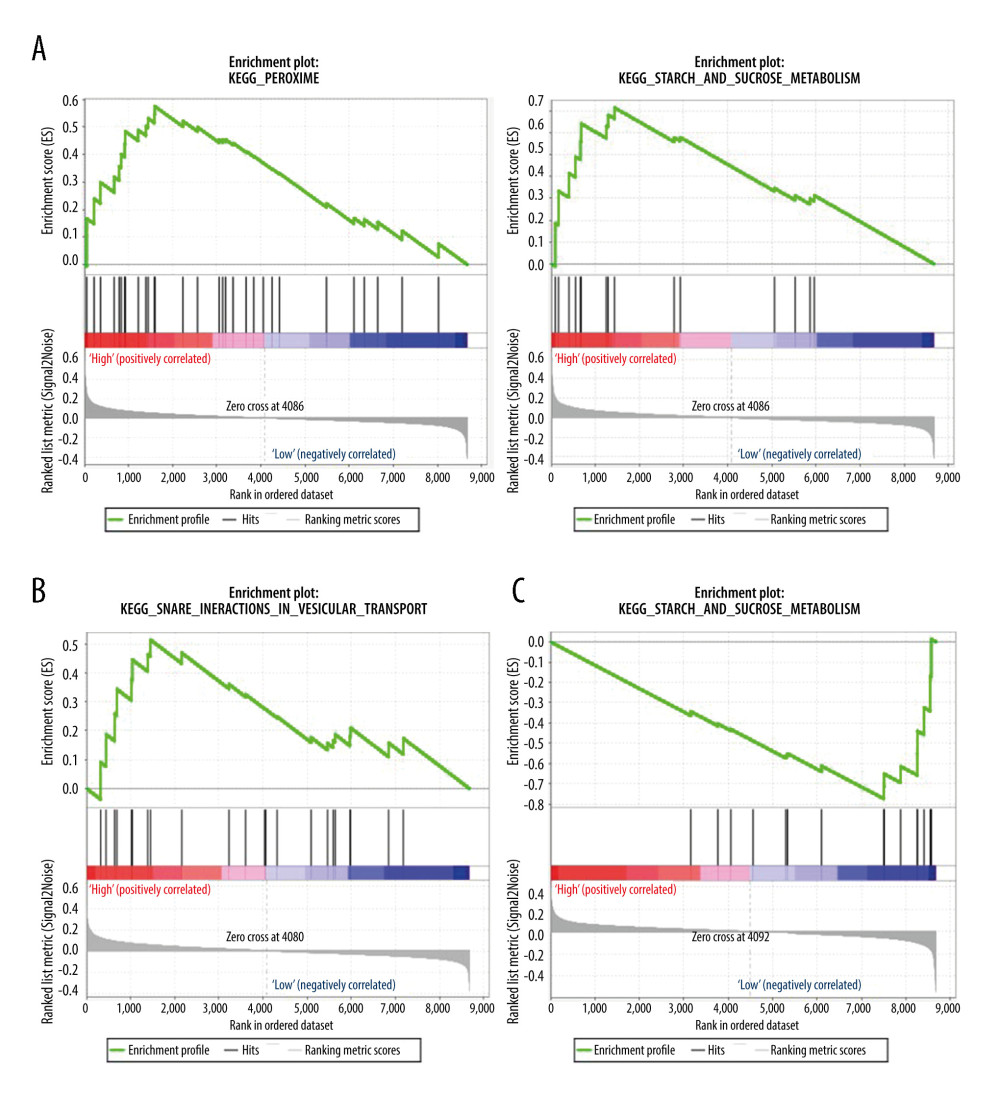 Figure 7. Gene set enrichment analysis (GSEA) for gene sets related to the expressions of 3 hub ARGs. (A) S1008A, (B) MyD88, and (C) NCR3.
 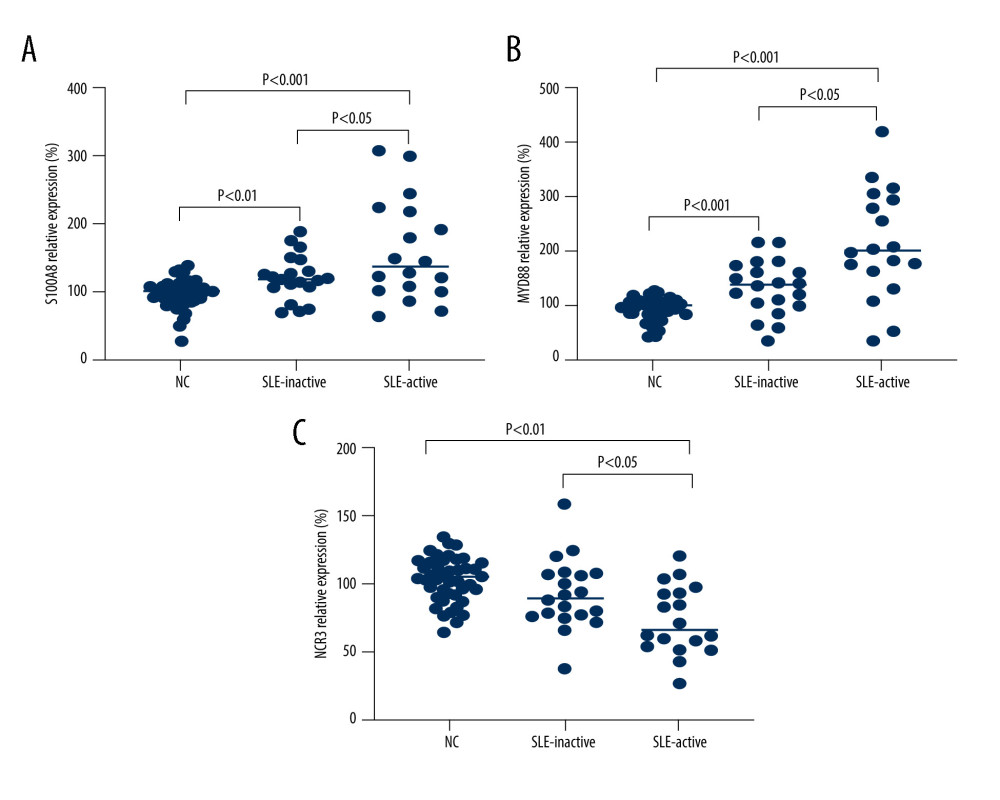 Figure 8. Verification of mRNA expression of hub ARGs between SLE and healthy samples. (A) S1008A, (B) MyD88, and (C) NCR3.
 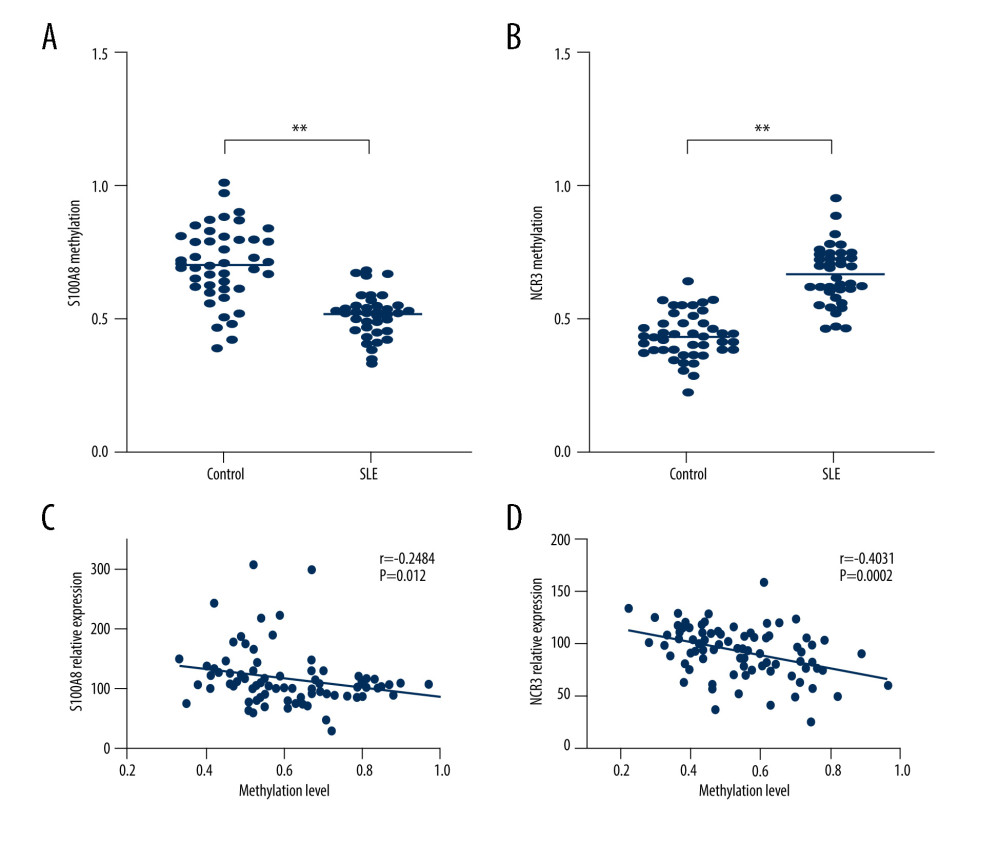 Figure 9. Correlation analyses of DNA methylation and gene expression. The methylation profiles of (A) S100A8 and (B) NCR3, and the correlation between these 2 gene expressions and methylation profiles (C, D).
 References
1. Yen EY, Shaheen M, Woo JMP, 46-year trends in systemic lupus erythematosus mortality in the United States, 1968 to 2013: A nationwide population-based study: Ann Intern Med, 2017; 167(11); 777-85
2. Lee YH, Choi SJ, Ji JD, Song GG, Overall and cause-specific mortality in systemic lupus erythematosus: An updated meta-analysis: Lupus, 2016; 25(7); 727-34
3. Zian Z, Maamar M, Aouni ME, Immunological and clinical characteristics of systemic lupus erythematosus: A series from Morocco: Biomed Res Int, 2018; 2018; 3139404
4. Linge P, Arve S, Olsson LM, NCF1-339 polymorphism is associated with altered formation of neutrophil extracellular traps, high serum interferon activity and antiphospholipid syndrome in systemic lupus erythematosus: Ann Rheum Dis, 2020; 79(2); 254-61
5. Zhao X, Zhang L, Wang J, Identification of key biomarkers and immune infiltration in systemic lupus erythematosus by integrated bioinformatics analysis: J Transl Med, 2021; 19(1); 35
6. Zhang L, Zhang M, Chen X, Identification of the tubulointerstitial infiltrating immune cell landscape and immune marker related molecular patterns in lupus nephritis using bioinformatics analysis: Ann Transl Med, 2020; 8(23); 1596
7. Qi YY, Zhao YF, Zhai YL, SCUBE3 is likely a susceptibility gene for systemic lupus erythematosus for Chinese populations: J Immunol Res, 2020; 2020; 8897936
8. Xiao N, Wei J, Xu S, cGAS activation causes lupus-like autoimmune disorders in a TREX1 mutant mouse model: J Autoimmun, 2019; 100; 84-94
9. Cătană CS, Atanasov AG, Berindan-Neagoe I, Natural products with anti-aging potential: Affected targets and molecular mechanisms: Biotechnol Adv, 2018; 36(6); 1649-56
10. Yin H, Wu H, Chen Y, The therapeutic and pathogenic role of autophagy in autoimmune diseases: Front Immunol, 2018; 9; 1512
11. Díaz M, García C, Sebastiani G, Placental and cord blood methylation of genes involved in energy homeostasis: Association with fetal growth and neonatal body composition: Diabetes, 2017; 66(3); 779-84
12. Wildenberg ME, Koelink PJ, Diederen K, The ATG16L1 risk allele associated with Crohn’s disease results in a Rac1-dependent defect in dendritic cell migration that is corrected by thiopurines: Mucosal Immunol, 2017; 10(2); 352-60
13. Tu Y, Guo R, Li J, MiRNA regulation of MIF in SLE and attenuation of murine lupus nephritis with miR-654: Front Immunol, 2019; 10; 2229
14. Duan L, Hu J, Xiong X, Liu Y, Wang J, The role of DNA methylation in coronary artery disease: Gene, 2018; 646; 91-97
15. Imgenberg-Kreuz J, Carlsson Almlöf J, Leonard D, DNA methylation mapping identifies gene regulatory effects in patients with systemic lupus erythematosus: Ann Rheum Dis, 2018; 77(5); 736-43
16. Hammaker D, Firestein GS, Epigenetics of inflammatory arthritis: Curr Opin Rheumatol, 2018; 30(2); 188-96
17. Lanata CM, Chung SA, Criswell LA, DNA methylation 101: What is important to know about DNA methylation and its role in SLE risk and disease heterogeneity: Lupus Sci Med, 2018; 5(1); e000285
18. Langfelder P, Horvath S, WGCNA: An R package for weighted correlation network analysis: BMC Bioinformatics, 2008; 9; 559
19. Huang da W, Sherman BT, Lempicki RA, Bioinformatics enrichment tools: Paths toward the comprehensive functional analysis of large gene lists: Nucleic Acids Res, 2009; 37(1); 1-13
20. Huang da W, Sherman BT, Lempicki RA, Systematic and integrative analysis of large gene lists using DAVID bioinformatics resources: Nat Protoc, 2009; 4(1); 44-57
21. Matwin S, Sazonova V, Direct comparison between support vector machine and multinomial naive Bayes algorithms for medical abstract classification: J Am Med Inform Assoc, 2012; 19(5); 917
22. Alanni R, Hou J, Azzawi H, Xiang Y, A novel gene selection algorithm for cancer classification using microarray datasets: BMC Med Genomics, 2019; 12(1); 10
23. Murphy TM, Crawford B, Dempster EL, Methylomic profiling of cortex samples from completed suicide cases implicates a role for PSORS1C3 in major depression and suicide: Transl Psychiatry, 2017; 7(1); e989
24. Mootha VK, Lindgren CM, Eriksson KF, PGC-1alpha-responsive genes involved in oxidative phosphorylation are coordinately downregulated in human diabetes: Nat Genet, 2003; 34(3); 267-73
25. Subramanian A, Tamayo P, Mootha VK, Gene set enrichment analysis: A knowledge-based approach for interpreting genome-wide expression profiles: Proc Natl Acad Sci USA, 2005; 102(43); 15545-50
26. Tan EM, Cohen AS, Fries JF, The 1982 revised criteria for the classification of systemic lupus erythematosus: Arthritis Rheum, 1982; 25(11); 1271-77
27. Wu G, Jia X, Gao D, Zhao Z, Survival rates and risk factors for mortality in systemic lupus erythematosus patients in a Chinese center: Clin Rheumatol, 2014; 33(7); 947-53
28. Gomes LR, Menck CFM, Leandro GS, Autophagy roles in the modulation of DNA repair pathways: Int J Mol Sci, 2017; 18(11); 2351
29. Ravanan P, Srikumar IF, Talwar P, Autophagy: The spotlight for cellular stress responses: Life Sci, 2017; 188; 53-67
30. Chen S, Liu M, Zhou Y, Bioinformatics analysis for cell-free tumor DNA sequencing data: Methods Mol Biol, 2018; 1754; 67-95
31. Nakano S, Morimoto S, Suzuki S, Up-regulation of the endoplasmic reticulum transmembrane protein UNC93B in the B cells of patients with active systemic lupus erythematosus: Rheumatology (Oxford), 2010; 49(5); 876-81
32. Chen DY, Lin CC, Chen YM, Involvement of TLR7 MyD88-dependent signaling pathway in the pathogenesis of adult-onset Still’s disease: Arthritis Res Ther, 2013; 15(2); R39
33. Pacheco GV, Novelo Noh IB, Velasco Cárdenas RM, Expression of TLR-7, MyD88, NF-κB, and INF-α in B lymphocytes of Mayan women with systemic lupus erythematosus in Mexico: Front Immunol, 2016; 7; 22
34. Müller H, Haug U, Rothenbacher D, Evaluation of serum and urinary myeloid related protein-14 as a marker for early detection of prostate cancer: J Urol, 2008; 180(4); 1309-13
35. Petri M, Orbai AM, Alarcón GS, Derivation and validation of the Systemic Lupus International Collaborating Clinics classification criteria for systemic lupus erythematosus: Arthritis Rheum, 2012; 64(8); 2677-86
36. Klein R, Moghadam-Kia S, LoMonico J, Development of the CLASI as a tool to measure disease severity and responsiveness to therapy in cutaneous lupus erythematosus: Arch Dermatol, 2011; 147(2); 203-8
37. Carvalheiro T, Gomes D, Pinto LA, Sera from patients with active systemic lupus erythematosus patients enhance the toll-like receptor 4 response in monocyte subsets: J Inflamm (Lond), 2015; 12; 38
38. Pons-Estel GJ, Alarcón GS, McGwin G, Protective effect of hydroxychloroquine on renal damage in patients with lupus nephritis: LXV, data from a multiethnic US cohort: Arthritis Rheum, 2009; 61(6); 830-39
39. Elloumi N, Fakhfakh R, Ayadi L, The increased expression of toll-like Receptor 4 in renal and skin lesions in lupus erythematosus: J Histochem Cytochem, 2017; 65(7); 389-98
40. Yao J, Xie J, Xie B, Therapeutic effect of hydroxychloroquine on colorectal carcinogenesis in experimental murine colitis: Biochem Pharmacol, 2016; 115; 51-63
41. Marchetti T, Ruffatti A, Wuillemin C, Hydroxychloroquine restores trophoblast fusion affected by antiphospholipid antibodies: J Thromb Haemost, 2014; 12(6); 910-20
42. Haga HJ, Brun JG, Berntzen HB, Calprotectin in patients with systemic lupus erythematosus: Relation to clinical and laboratory parameters of disease activity: Lupus, 1993; 2(1); 47-50
43. Moretta A, Biassoni R, Bottino C, Natural cytotoxicity receptors that trigger human NK-cell-mediated cytolysis: Immunol Today, 2000; 21(5); 228-34
44. Puxeddu I, Bongiorni F, Chimenti D, Cell surface expression of activating receptors and co-receptors on peripheral blood NK cells in systemic autoimmune diseases: Scand J Rheumatol, 2012; 41(4); 298-304
45. Vinson C, Chatterjee R, CG methylation: Epigenomics, 2012; 4(6); 655-63
46. Gong G, Lin T, Yuan Y, Integrated analysis of gene expression and DNA methylation profiles in ovarian cancer: J Ovarian Res, 2020; 13(1); 30
47. Feinberg AP, Tycko B, The history of cancer epigenetics: Nat Rev Cancer, 2004; 4(2); 143-53
48. Lu Q, Wu A, Richardson BC, Demethylation of the same promoter sequence increases CD70 expression in lupus T cells and T cells treated with lupus-inducing drugs: J Immunol, 2005; 174(10); 6212-19
49. Lu Q, Wu A, Tesmer L, Demethylation of CD40LG on the inactive X in T cells from women with lupus: J Immunol, 2007; 179(9); 6352-58
50. Jeffries MA, Dozmorov M, Tang Y, Genome-wide DNA methylation patterns in CD4+ T cells from patients with systemic lupus erythematosus: Epigenetics, 2011; 6(5); 593-601
51. Zhao M, Liu S, Luo S, DNA methylation and mRNA and microRNA expression of SLE CD4+ T cells correlate with disease phenotype: J Autoimmun, 2014; 54; 127-36
Figures
Figure 1. Construction of co-expression modules using the WGCNA package in R. (A) Analysis of the scale-free fit index for various soft-thresholding powers (β). The red line represents the merging threshold. (B) Analysis of the mean connectivity for various soft-thresholding powers. (C) The cluster dendrogram of genes in GSE81622. (D) Interaction relationship analysis of coexpressed genes. (E) Hierarchical clustering of module hub genes that summarize the modules yielded in the clustering analysis. (F) Heatmap plot of the adjacencies in the hub gene network.Figure 2. Hub genes in the network and red module. (A) Heatmap plot of the adjacencies in the hub gene network. (B) Scatter plot of module eigengenes in the red module.Figure 3. Top 10 GO analysis and KEGG pathway enrichment results for genes in red module. (A) The biological process group, (B) the cellular component group, (C) the molecular function group. (D) KEGG pathway enrichment result. The size of the bubble shows the gene ratios, while colors indicate the P value.Figure 4. Identification of feature ARGs. (A) Selection of real hub genes in the ARGs and red modules. (B) Correlation heatmap shows gene co-expression patterns among ARGs. The colors represent correlations, and the size of the circles represent the size of the p values. (C) Boxplot shows the median expression level of each ARGs in both control and SLE samples, represented by red and green boxes, respectively.Figure 5. Selection of the differentially expressed ARGs that are related to disease. (A) The most appropriate log (Lambda) value in the LASSO model. (B) Log (Lambda) value of the 18 ARGs in least absolute shrinkage and selection operator (LASSO) model. (C) Multivariate Cox regression analysis shows the ARGs identified for risk signature construction by age, sex, and (D) disease state.Figure 6. Methylation profiles of hub ARGs in GSE96879. (A) Receiver operating characteristic (ROC) curves for the diagnosis efficacy of ARGs. (B) The top 20 DMPs in GSE96879 dataset as shown in heatmap. The beta value of (C) S1008A, (D) Myd88, and (E) NCR3 were exhibited from GSE96879. Beta value indicated methylation level.Figure 7. Gene set enrichment analysis (GSEA) for gene sets related to the expressions of 3 hub ARGs. (A) S1008A, (B) MyD88, and (C) NCR3.Figure 8. Verification of mRNA expression of hub ARGs between SLE and healthy samples. (A) S1008A, (B) MyD88, and (C) NCR3.Figure 9. Correlation analyses of DNA methylation and gene expression. The methylation profiles of (A) S100A8 and (B) NCR3, and the correlation between these 2 gene expressions and methylation profiles (C, D). Tables
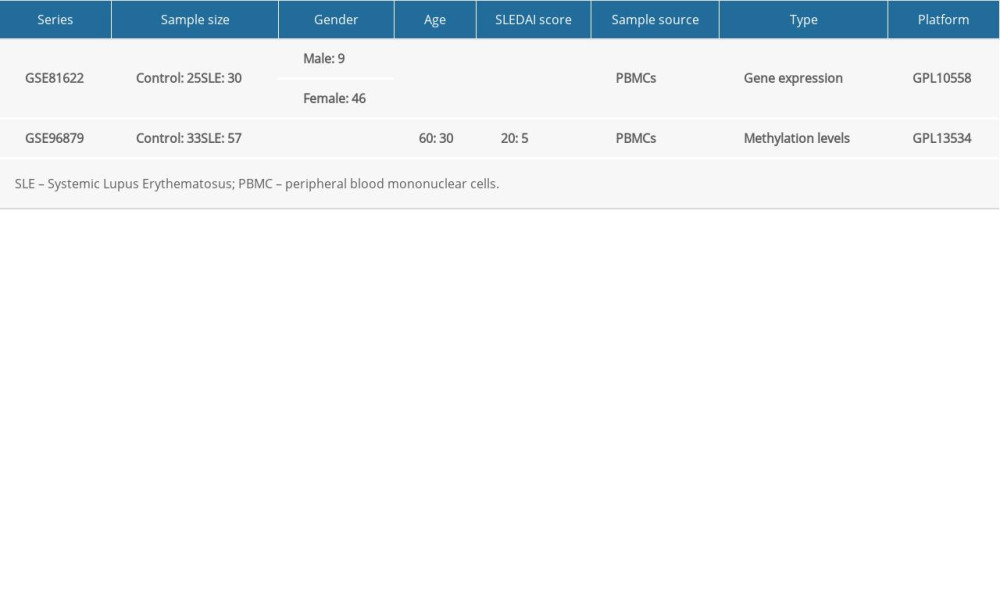 Table 1. The detailed clinical information of samples in GSE81622 and GSE96879.
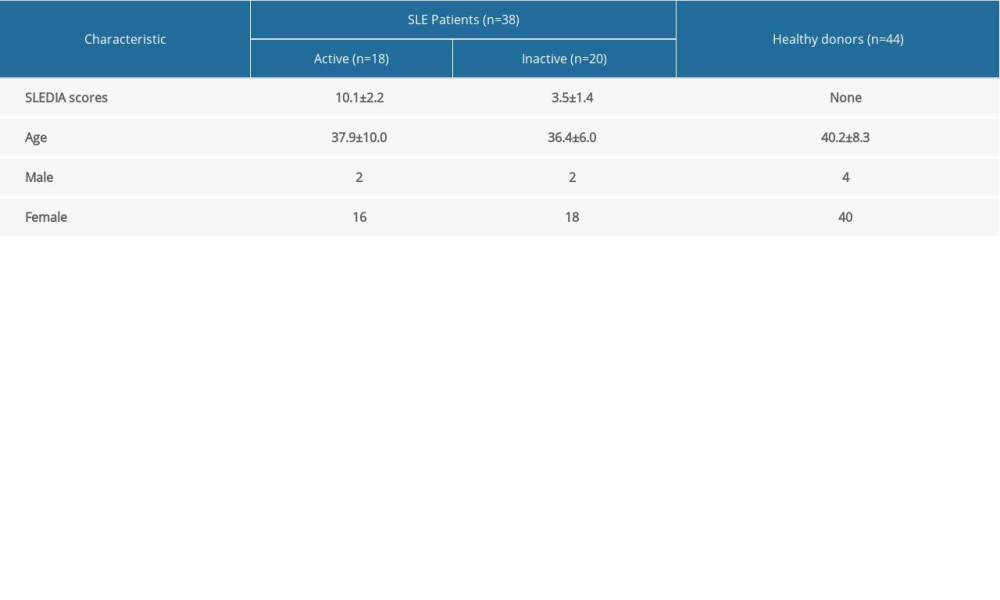 Table 2. The baseline characteristics of all the subjects.
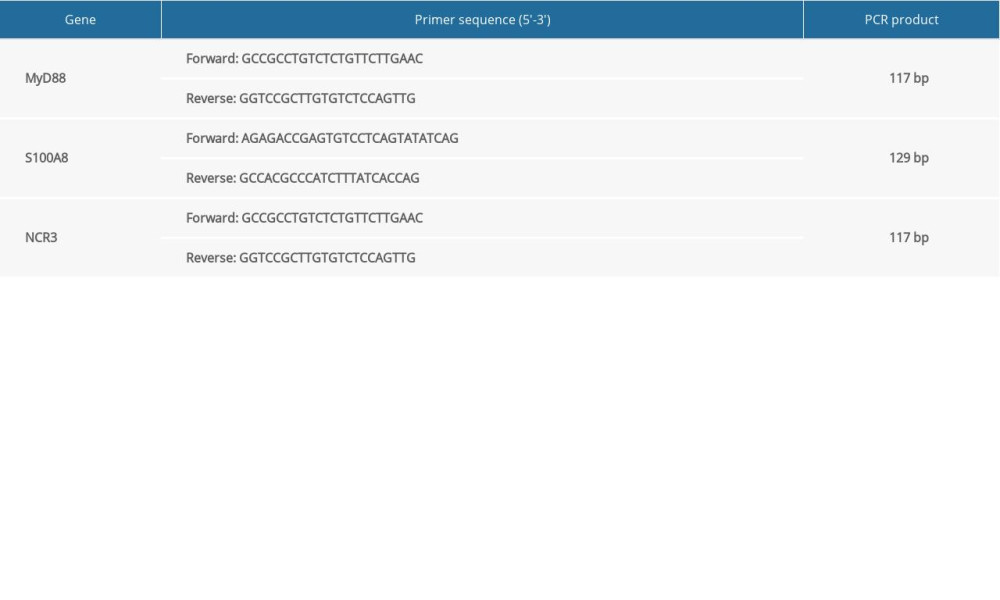 Table 3. The RT-PCR primer sequences of the hub genes.
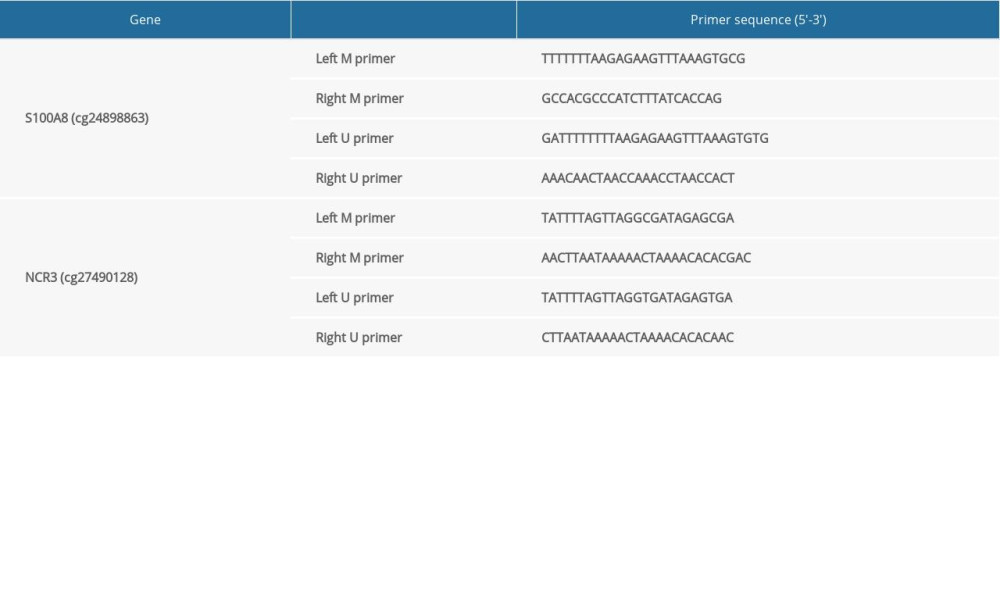 Table 4. The MSP primer sequences of S100A8 and NCR3.Table 1. The detailed clinical information of samples in GSE81622 and GSE96879.Table 2. The baseline characteristics of all the subjects.Table 3. The RT-PCR primer sequences of the hub genes.Table 4. The MSP primer sequences of S100A8 and NCR3.
 In Press
05 Mar 2024 : Clinical Research
Muscular Function Recovery from General Anesthesia in 132 Patients Undergoing Surgery with Acceleromyograph...Med Sci Monit In Press; DOI: 10.12659/MSM.942780
05 Mar 2024 : Clinical Research
Effects of Thermal Insulation on Recovery and Comfort of Patients Undergoing Holmium Laser LithotripsyMed Sci Monit In Press; DOI: 10.12659/MSM.942836
05 Mar 2024 : Clinical Research
Role of Critical Shoulder Angle in Degenerative Type Rotator Cuff Tears: A Turkish Cohort StudyMed Sci Monit In Press; DOI: 10.12659/MSM.943703
06 Mar 2024 : Clinical Research
Comparison of Outcomes between Single-Level and Double-Level Corpectomy in Thoracolumbar Reconstruction: A ...Med Sci Monit In Press; DOI: 10.12659/MSM.943797
Most Viewed Current Articles
17 Jan 2024 : Review article
Vaccination Guidelines for Pregnant Women: Addressing COVID-19 and the Omicron VariantDOI :10.12659/MSM.942799
Med Sci Monit 2024; 30:e942799
14 Dec 2022 : Clinical Research
Prevalence and Variability of Allergen-Specific Immunoglobulin E in Patients with Elevated Tryptase LevelsDOI :10.12659/MSM.937990
Med Sci Monit 2022; 28:e937990
16 May 2023 : Clinical Research
Electrophysiological Testing for an Auditory Processing Disorder and Reading Performance in 54 School Stude...DOI :10.12659/MSM.940387
Med Sci Monit 2023; 29:e940387
01 Jan 2022 : Editorial
Editorial: Current Status of Oral Antiviral Drug Treatments for SARS-CoV-2 Infection in Non-Hospitalized Pa...DOI :10.12659/MSM.935952
Med Sci Monit 2022; 28:e935952